
The S&P 500 has moved slightly lower during Wednesday’s session and the small correction we were expecting may already be over.
We now have short term, mid term and long term targets with only the one daily wave count.
Today I have an alternate hourly wave count, but its probability is significantly lower than the main hourly wave count.
Click on the charts below to enlarge.
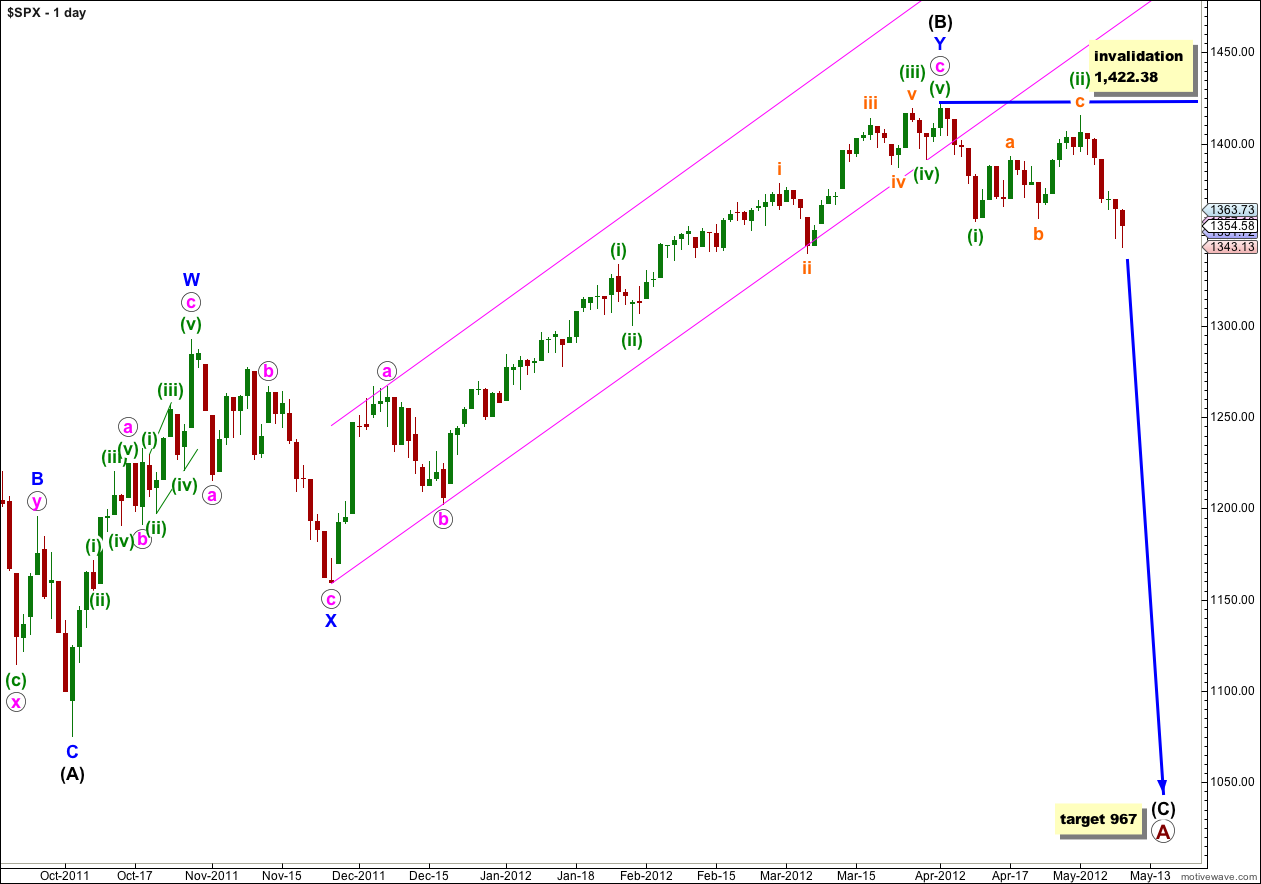
It looks highly likely that we have recently seen a very large trend change on the S&P 500 and a new downwards trend, to last months, has begun.
At primary degree wave A is an expanded flat correction. Wave (A) black within it subdivides into a three, and wave (B) black is over 105% of wave (A) black at 123%. The minimum requirements for an expanded flat are met. We should expect wave (C) black to subdivide into a five and move price substantially beyond the end of wave (A) black at 1,074.77.
At 967 wave (C) black would reach 1.618 the length of wave (A) black. If price continues through this first target, or it gets there and the structure is incomplete, then our second (less likely) target is at 685 where wave (C) black would reach 2.618 the length of wave (A) black.
Wave (A) black lasted 4 months. Wave (B) black lasted 6 months. We may expect wave (C) black to last at least 4 months, if not longer.
If wave (ii) green continues further as a double flat or combination it may not move beyond the start of wave (i) green. This wave count is invalidated with movement above 1,422.38.
Main Hourly Wave Count.
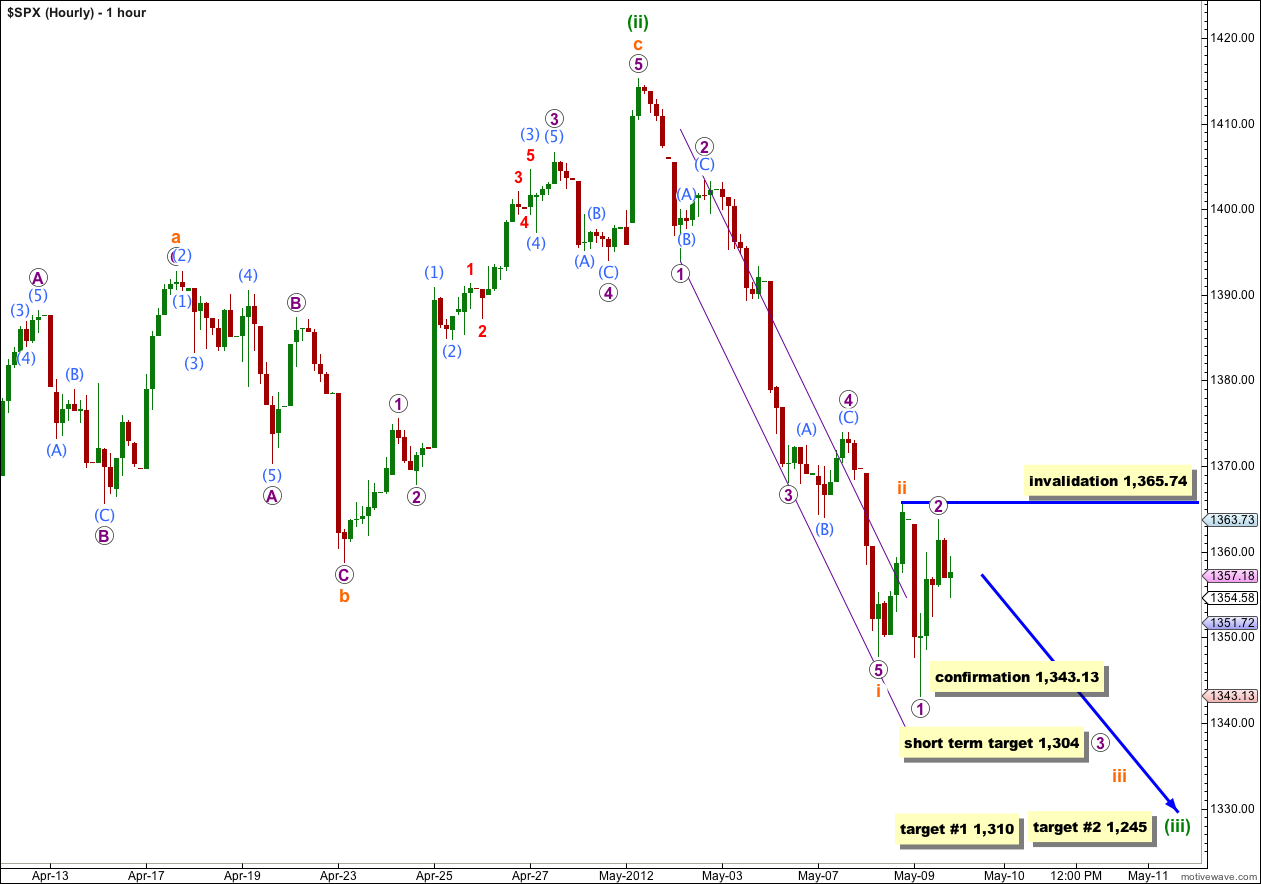
Subdivisions on the 5 minute chart favour this wave count. Wave ii orange may already be over as a single brief zigzag.
Downwards movement labeled 1 purple within iii orange subdivides perfectly as a five wave impulse on the 5 minute chart. Upwards movement labeled 2 purple within iii orange subdivides into a clear zigzag structure on the 5 minute chart.
Movement below 1,343.13 would provide some confirmation of this wave count. At that stage we should expect wave ii orange is over and we would be in the middle of wave (iii) green downwards.
If this wave count is correct then tomorrow should see an increase in downwards momentum.
For the short term wave 3 purple would reach 2.618 the length of wave 1 purple at 1,304. I am using 2.618 rather than 1.618 because wave 2 purple was an extremely deep 91% correction of wave 1 purple. This target fits only with the second lower target for wave (iii) green.
In the mid term wave (iii) green would reach 1.618 the length of wave (i) green at 1,310. If price reaches this first target and keeps falling, or if it gets there and the structure is incomplete, our second target is at 1,245 where wave (iii) green would reach 2.618 the length of wave (i) green.
If wave 2 purple extends higher it may not move beyond the start of wave 1 purple. This wave count is invalidated with movement above 1,365.74. Only if this wave count is invalidated with upwards movement should we use the less likely alternate below.
Alternate Hourly Wave Count.
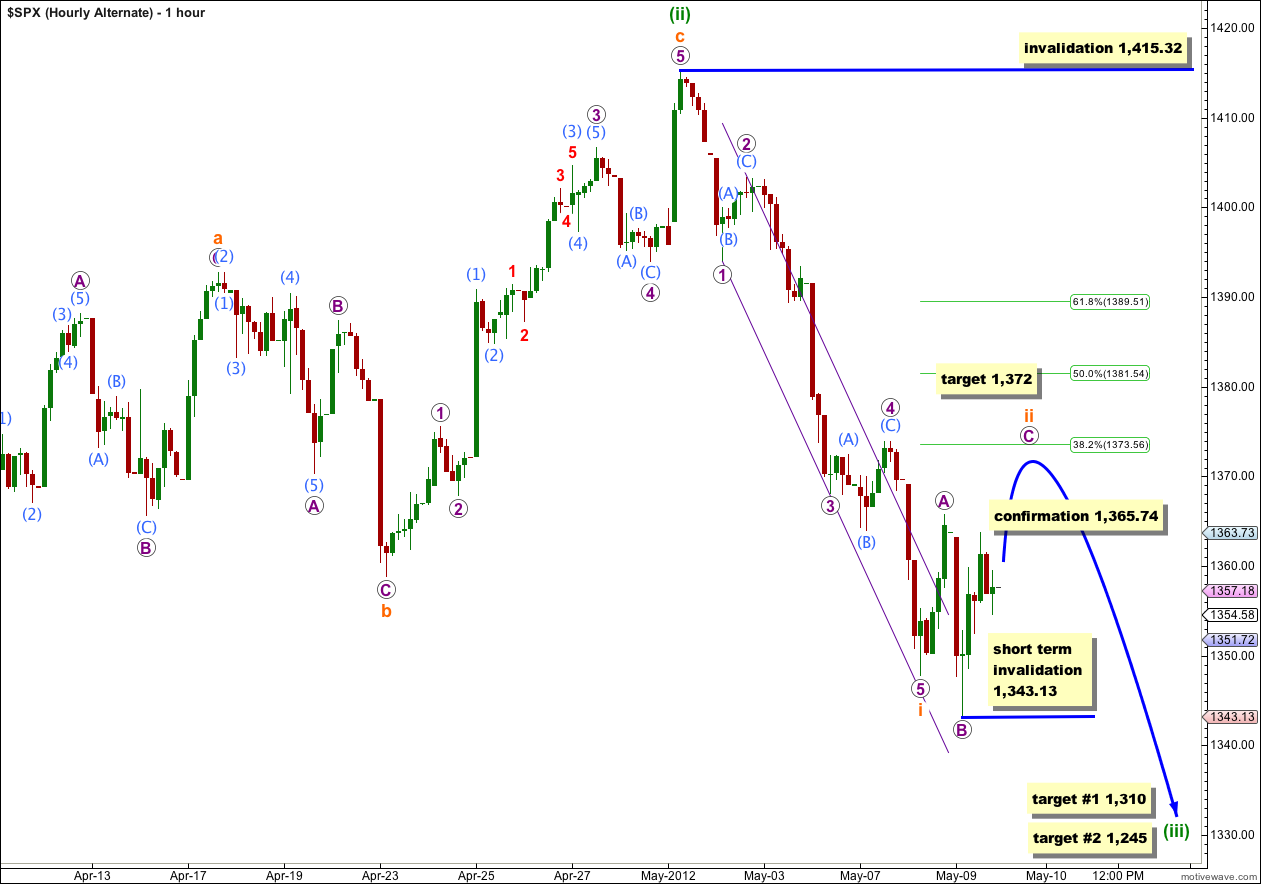
This wave count has a much lower probability because the subdivisions, particularly of wave B purple downwards, do not fit on the 5 minute chart. However, if the main wave count is invalidated by upwards movement then this may provide an adequate explanation.
At 1,372 wave C purple would reach 1.618 the length of wave A purple. This would bring wave ii orange to just below the 0.382 Fibonacci ratio of wave i orange.
Within wave C purple no second wave correction may move beyond the start of the first wave. This wave count is invalidated with movement below 1,343.13.
Mid term targets remain the same for wave (iii) green, which are still about 2 weeks or so away.
The next few days are key …. thanks for the thoughts
Could you email me a count for a Major Fifth Wave… what it would look like at this point or add one more alternate.
Thanks
I’m only going to develop another alternate if it has the right look. At this stage all the alternates I’ve had are invalidated. For wave iv pink to be continuing would look very strange indeed. So I don’t want to chart that for you.
Thanks for your thoughts … just trying to workout a Major Fifth Wave into 1477 area.
But you are right we need more time and next week should be fun.
You are doing a great job!!
With the 30 day bullish divergence that the McClellan Oscillator is showing
-103.23 vs SPX 1358.59 (low 1357.38) on 4/10
-62.11 vs SPX 1354.58 (low 1343.13) on 5/09
The market is trying to show a head fake and looking to push over 1393.92 next week. IMO
I just find it hard to be a bear over 1340.00.
What type of odds would you give the market going over 1393.92?
Thanks!
Thanks Karen! So far heaps better than last week. It’s always tricky around big trend changes.
Over 1,393.92 the alternate hourly wave count would still be valid, so the difference in probability is the difference between my two hourly wave counts.
I would estimate the alternate hourly wave count would have a low probability, about 30%.
Movement to a new low 2 days ago, below that confirmation point for the main daily wave count, increases the probability of a long term bearish EW count significantly.