
Movement below 1,357.38 has confirmed our main wave count and invalidated our alternate. We have clarity with only one wave count.
Our main wave count expected downwards movement yesterday to a short term target at 1,353. Price moved lower to reach 5.25 points below our target for the session, before turning strongly upwards which was expected once the downwards structure was complete.
I now have more confidence in calculating mid and long term targets.
Click on the charts below to enlarge.
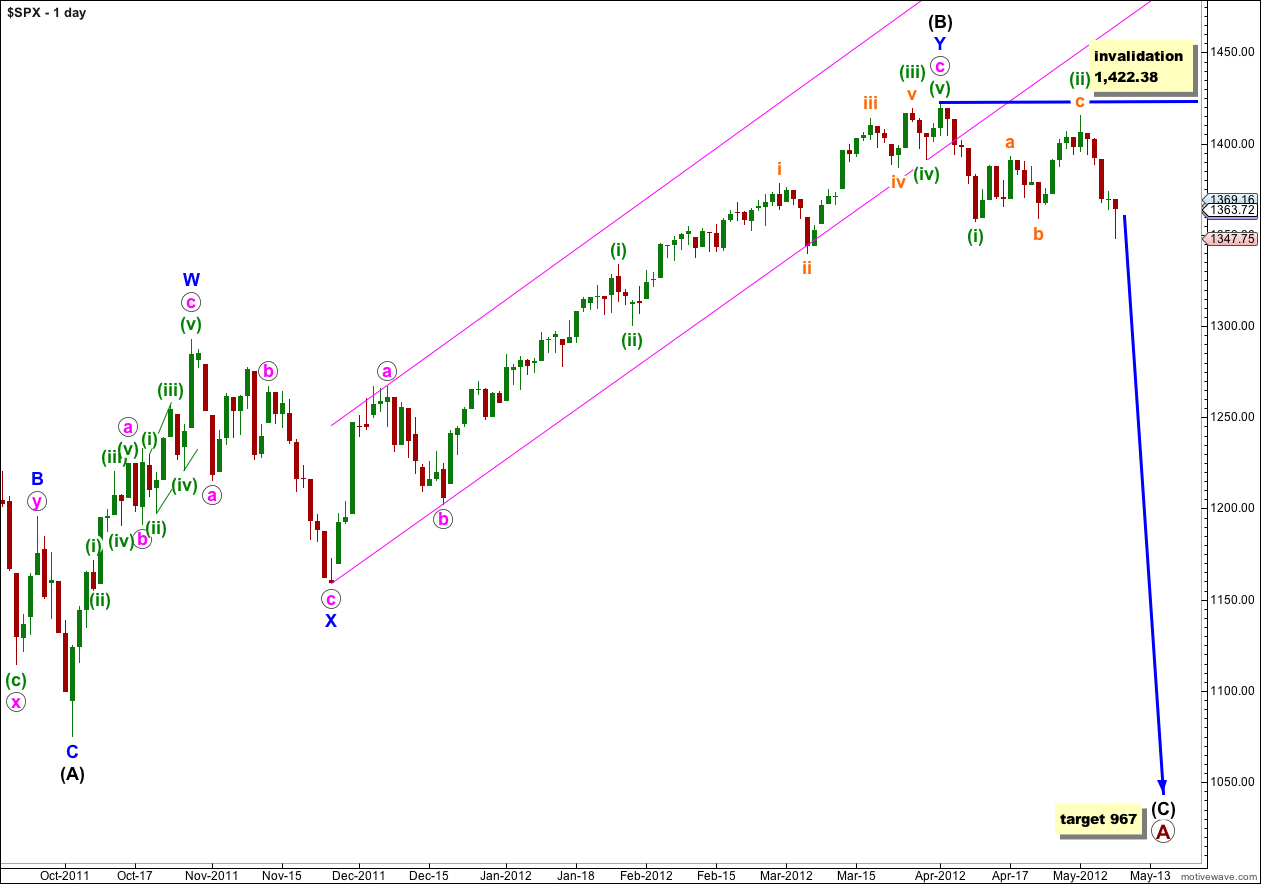
Finally, movement below 1,357.38 has confirmed this wave count. It looks highly likely that we have recently seen a very large trend change on the S&P 500 and a new downwards trend, to last months, has begun.
At primary degree wave A is an expanded flat correction. Wave (A) black within it subdivides into a three, and wave (B) black is over 105% of wave (A) black at 123%. The minimum requirements for an expanded flat are met. We should expect wave (C) black to subdivide into a five and move price substantially beyond the end of wave (A) black at 1,074.77.
At 967 wave (C) black would reach 1.618 the length of wave (A) black. If price continues through this first target, or it gets there and the structure is incomplete, then our second (less likely) target is at 685 where wave (C) black would reach 2.618 the length of wave (A) black.
Wave (A) black lasted 4 months. Wave (B) black lasted 6 months. We may expect wave (C) black to last at least 4 months, if not longer.
If wave (ii) green continues further as a double flat or combination it may not move beyond the start of wave (i) green. This wave count is invalidated with movement above 1,422.38.
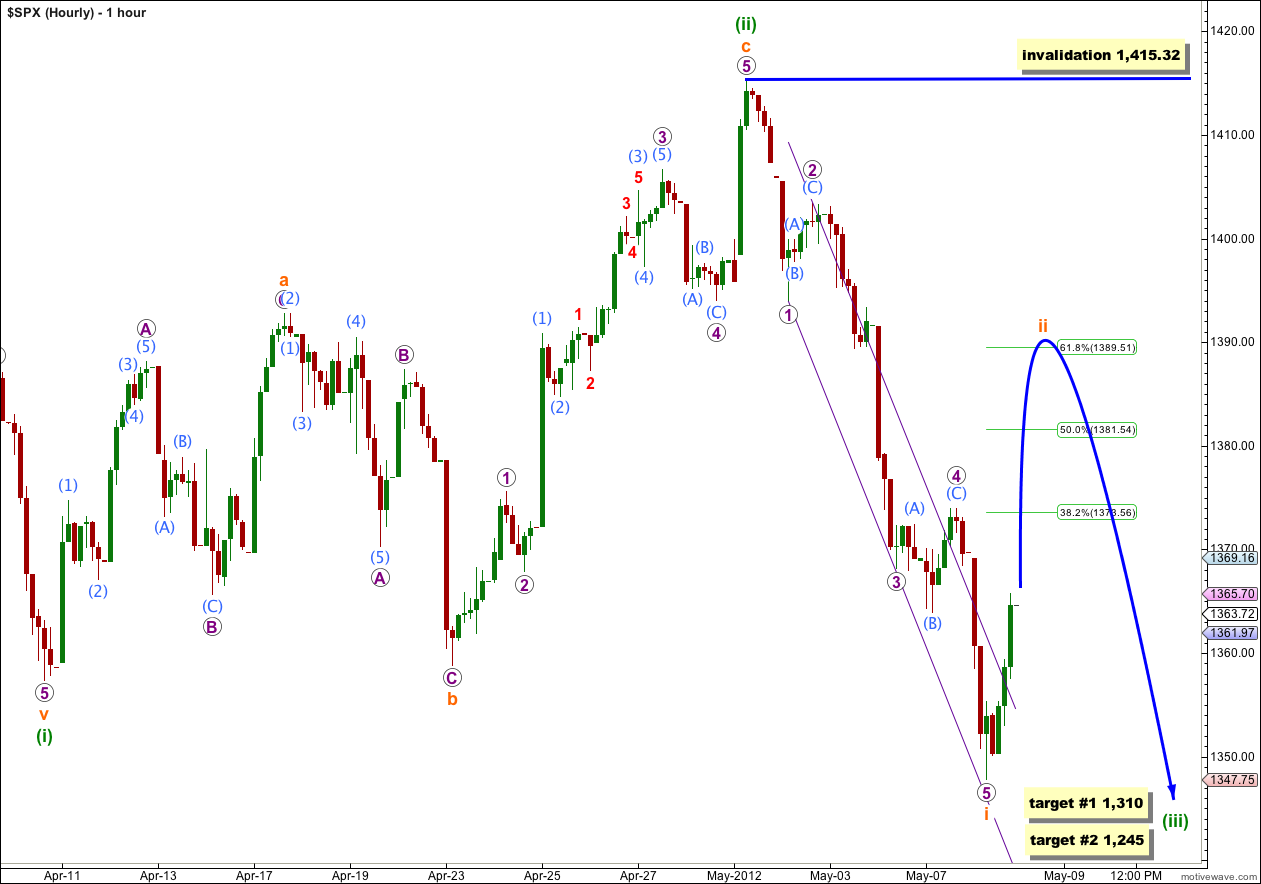
Wave i orange downwards is a perfect five wave impulse. Wave 3 purple is just 0.62 points longer than 1.618 the length of wave 1 purple, but there is no Fibonacci ratio between wave 5 purple and either of 1 or 3 purple. This is actually pretty typical, but it does make target calculation more tricky.
When we use Elliott’s first channeling technique to draw a small parallel channel about wave i orange downwards the fourth wave has an overshoot, and the fifth wave ends perfectly at the lower edge of the channel.
This channel is breached by upwards movement from the end of Tuesday’s session. This indicates that this first five down is complete and we should now expect a second wave correction.
At this early stage we may expect wave ii orange to be fairly likely to reach up to the 0.618 Fibonacci ratio of wave i orange at 1,389.51. However, it does not have to. When we have waves A and B purple within it complete we may use the ratio of A to C purple to calculate a target.
Wave ii orange must subdivide into a three wave structure. When we can clearly see a three on the hourly chart then it could be over.
Wave i orange lasted 5 days. Wave ii orange may last at least 2 days, and possibly about 5 days.
In the mid term wave (iii) green would reach 1.618 the length of wave (i) green at 1,310. If price reaches this first target and keeps falling, or if it gets there and the structure is incomplete, our second target is at 1,245 where wave (iii) green would reach 2.618 the length of wave (i) green.
Wave ii orange may not move beyond the start of wave i orange. This wave count is invalidated with movement above 1,415.32.
Looking like a “Broadening Top” — upward 49.6%, downward 50.3% of the time.
It sure does have a really typical look so far, that top with the nice curve is typical of the S&P