
Last analysis expected price to most likely move higher during Thursday’s session. The S&P 500 has moved lower, finding support exactly at the lower edge of the parallel channel on the daily chart and remaining just above our invalidation point on the hourly chart.
We should expect that our main wave count is correct and that price should continue towards our target. The only question is for how long?
Click on the charts below to enlarge.
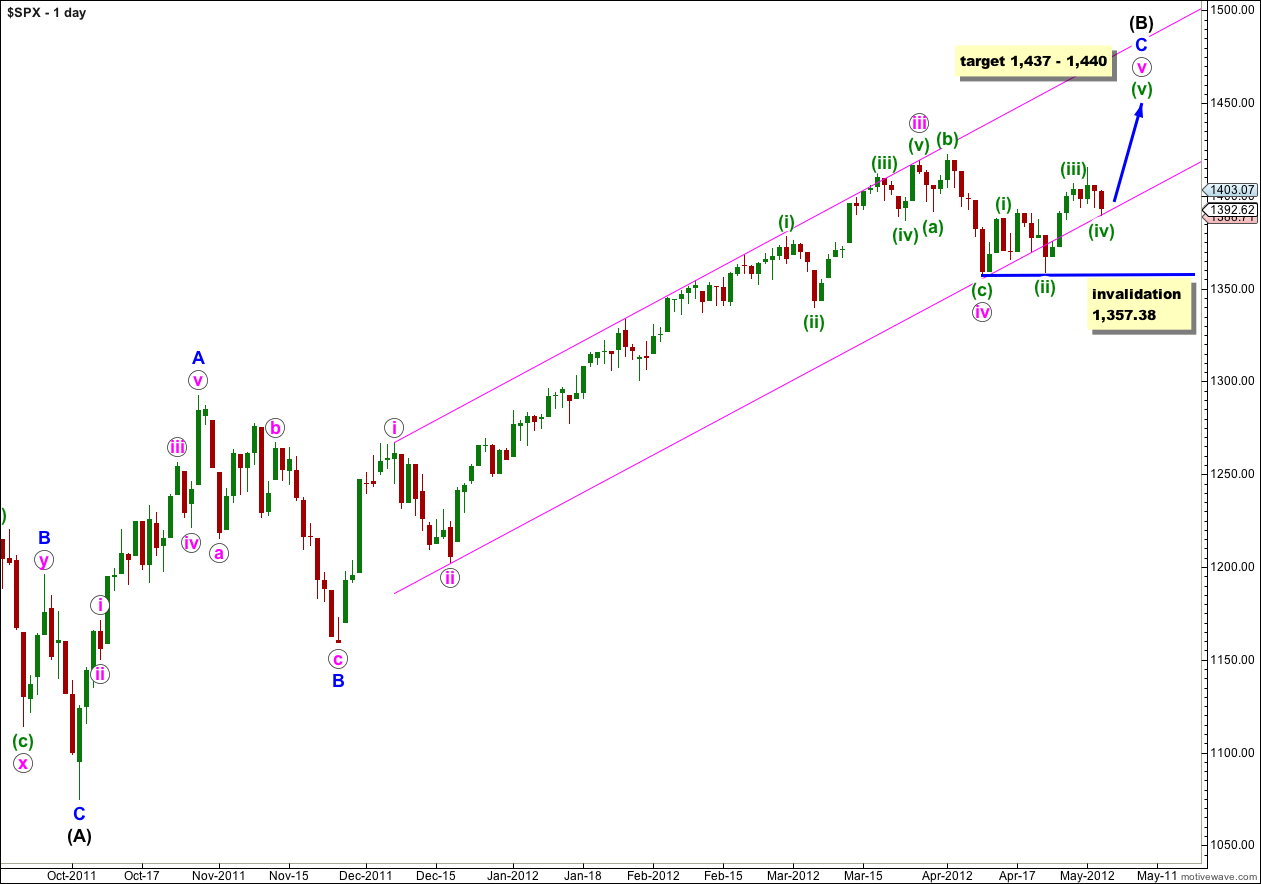
This wave count still looks like it has the highest probability between our two daily wave counts.
This wave count expects the S&P 500 is within a final fifth wave upwards to complete a single zigzag correction for wave (B) black. The target has been recalculated again today to 1,440 where wave v pink would reach 0.382 the length of wave iii pink. At one degree lower wave (v) geen would reach equality with wave (iii) green at 1,437. This gives us a 3 point target zone.
When wave v pink is complete we shall look out for a big trend change. Movement below 1,357.38 will confirm a big trend change and the start of wave (C) black downwards. This price point will be extremely important for us because while price remains above that point the risk of new highs will remain.
Wave (B) black would reach its maximum common length, 138% of wave (A) black, at 1,464. It is likely we shall see a trend change before this point.
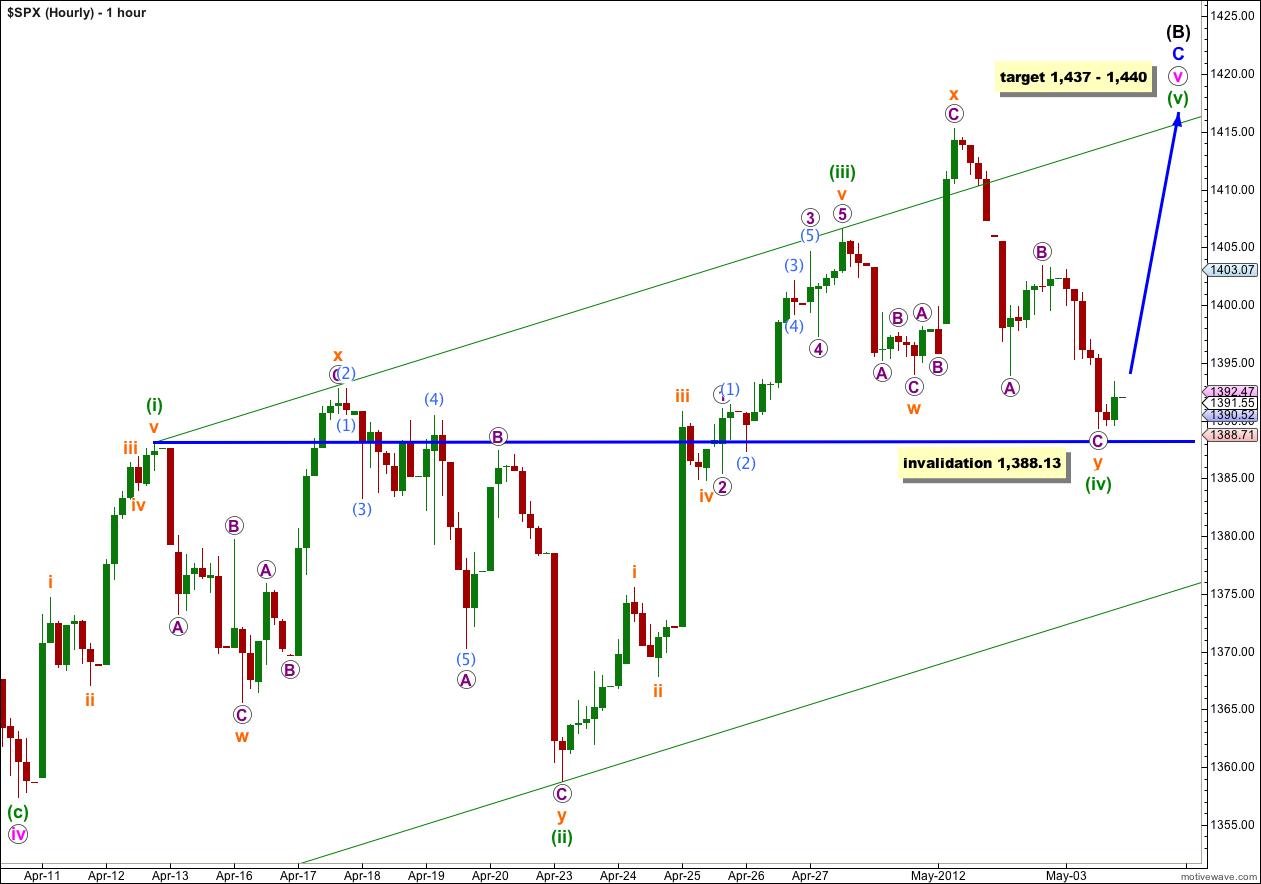
Despite price moving lower this main hourly wave count remains valid and still has a higher probability than the alternate.
Wave (iv) green now subdivides into a double zigzag structure and there is no structural alternation between waves (ii) and (iv) green. There is alternation in depth of correction: wave (ii) green is a very deep 95% correction of wave (i) green and wave (iv) green is a shallow 36% correction of wave (iii) green.
If this wave count is correct then we must see upwards movement for Friday’s session. There is no further room for downwards movement, and the lower edge of the trend channel on the daily chart should provide strong support.
If wave (v) green is to reach equality with wave (iii) green at 1,437 then it may also last at minimum 4 days and probably longer, as it will have lower momentum than the third wave.
Alternate Hourly Wave Count.
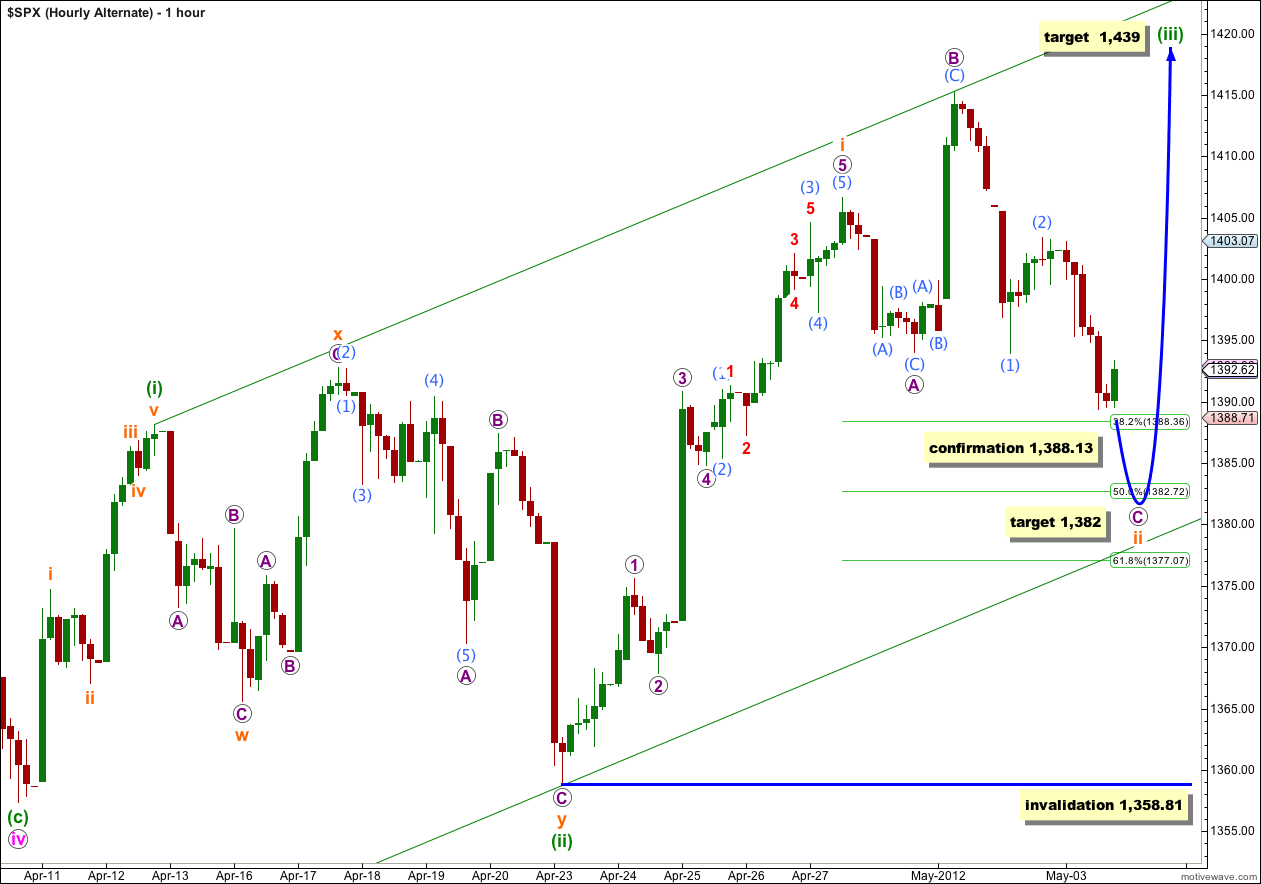
Only if price moves below 1,388.13 should we use this wave count. If price turns upwards tomorrow, not breaching 1,388.13, then our main wave count would be confirmed and this alternate may be discarded.
This alternate looks at the less likely possibility that wave (iii) green is extending beyond 1.618 the length of wave (i) green. At 1,439 wave (iii) green would reach 2.618 the length of wave (i) green.
Within wave ii orange the structure would most likely be an expanded flat correction with wave C purple incomplete. At 1,382 wave C purple would reach 2.618 the length of wave A purple and wave ii orange would be just at the 50% level of wave i orange.
Wave ii orange may not move beyond the start of wave i orange. This wave count is invalidated with movement below 1,358.81. If this wave count is invalidated with movement below this price point then we should wait to see if price can move below 1,357.38, just 1.43 points below. If it does then the alternate wave count below would be correct.
Alternate Daily Wave Count.

This wave count is now our alternate, and with the Dow invalidating its equivalent wave count during Tuesday’s session I expect this wave count will be invalidated very soon with upwards movement.
We need to see price move below 1,357.38 to invalidate our main wave count and confirm this alternate before we may have confidence that the S&P 500 has had a trend change. While price remains above that point our main wave count will remain viable and new highs possible.
Correction – I was meant to refer to wave 4 of 3 of 1 down rather than saying wave 4 of 1 of 3 down. Sorry – posting charts would be a lot easier and more descriptive.
Like the way the bears used stealth to knock out the primary pivot at 1394. Yes – 1365.57 has to hold to break the decline but if not and the other two primary pivots fail (1357.38 and 1340.03) I would say the bears have succeeded in a major house of cards decline to initial support at 1267.06.
Looks like the current wave structure could be at wave 4 of 1 of 3 down to enable wave 5 of 1 of 3 down to proceed to 1351 if wave 1 of 1 of 3 down = the forthcoming wave 5 down. This would leave wave two up to commence prior to attacking and knocking out 1340.03 in a larger degree wave 3 decline after wave 2 up is completed. In short, good potential for 1357.38 to be taken out shortly. If not, then this unbelievable upward correction continues for a little while longer.
Looking for a major bounce 1st part of next week 1365.57 KEY
Charts #1 & 2 don’t work for ES_F cuz wave (iv) on today overlaps wave (i) on 4/12/12. So, should we eliminate that particular wavecount from SPX as well?
can you make an hourly analysis of alternate daily wave?
End of week analysis will have hourly counts for both main and alternates.