
The S&P 500 has moved lower invalidating both of our hourly wave counts. However, I have a new main hourly wave count which has an excellent look and excellent Fibonacci ratios. We may expect the target should be reached by the end of this week or early next week.
Click on the charts below to enlarge.
This wave count is now our highest probability wave count since the Dow has made a new high. I expect the S&P 500 will follow within the next few days and invalidate the alternate wave count.
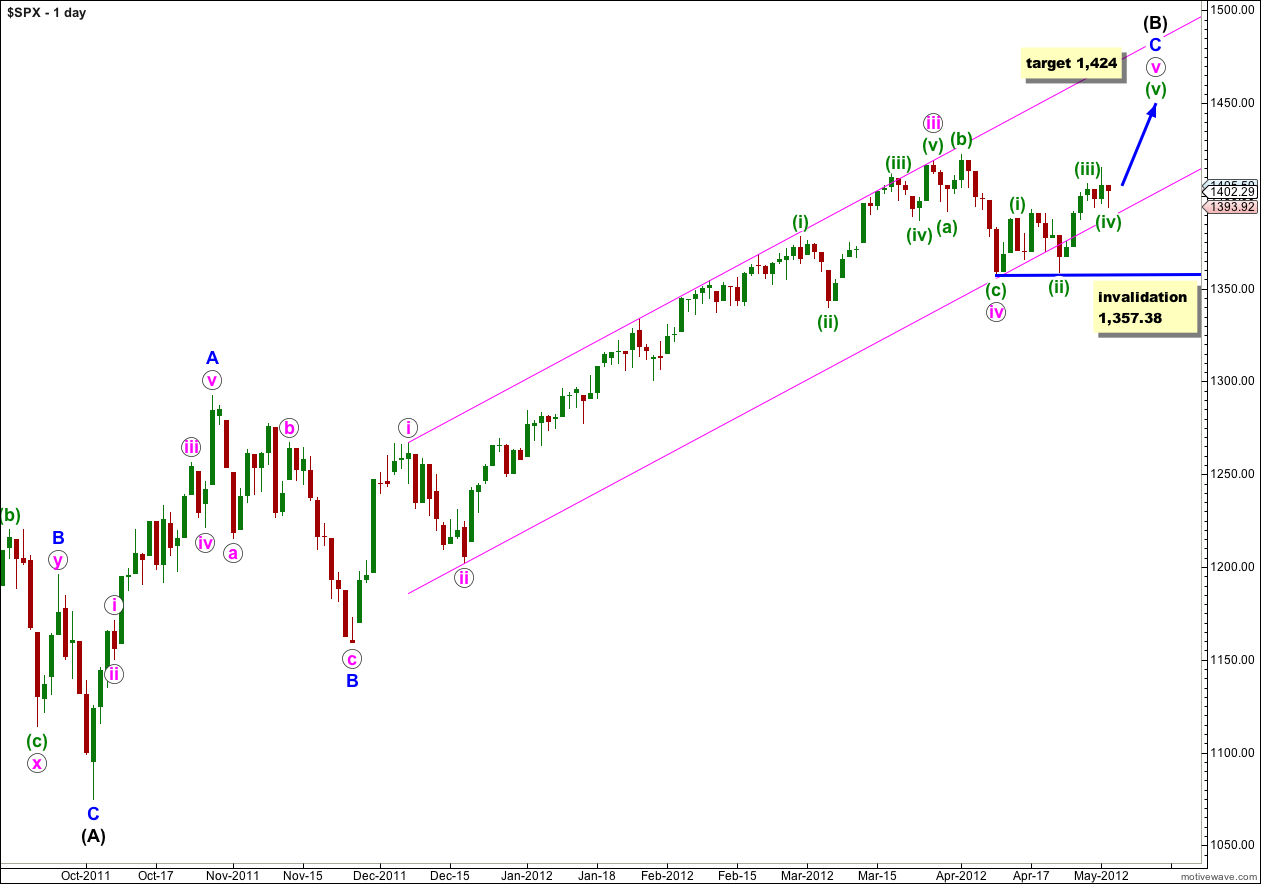
This wave count expects the S&P 500 is within a final fifth wave upwards to complete a single zigzag correction for wave (B) black. The target has been recalculated today to 1,424 where wave v pink would reach 0.618 the length of wave i pink. This target fits perfectly with one degree lower- wave (v) green would reach equality with wave (i) green at 1,424. Because this price point is the same for two degrees it has a high probability.
When wave v pink is complete we shall look out for a big trend change. Movement below 1,357.38 will confirm a big trend change and the start of wave (C) black downwards. This price point will be extremely important for us because while price remains above that point the risk of new highs will remain.
Wave (B) black would reach its maximum common length, 138% of wave (A) black, at 1,464. It is likely we shall see a trend change before this point.
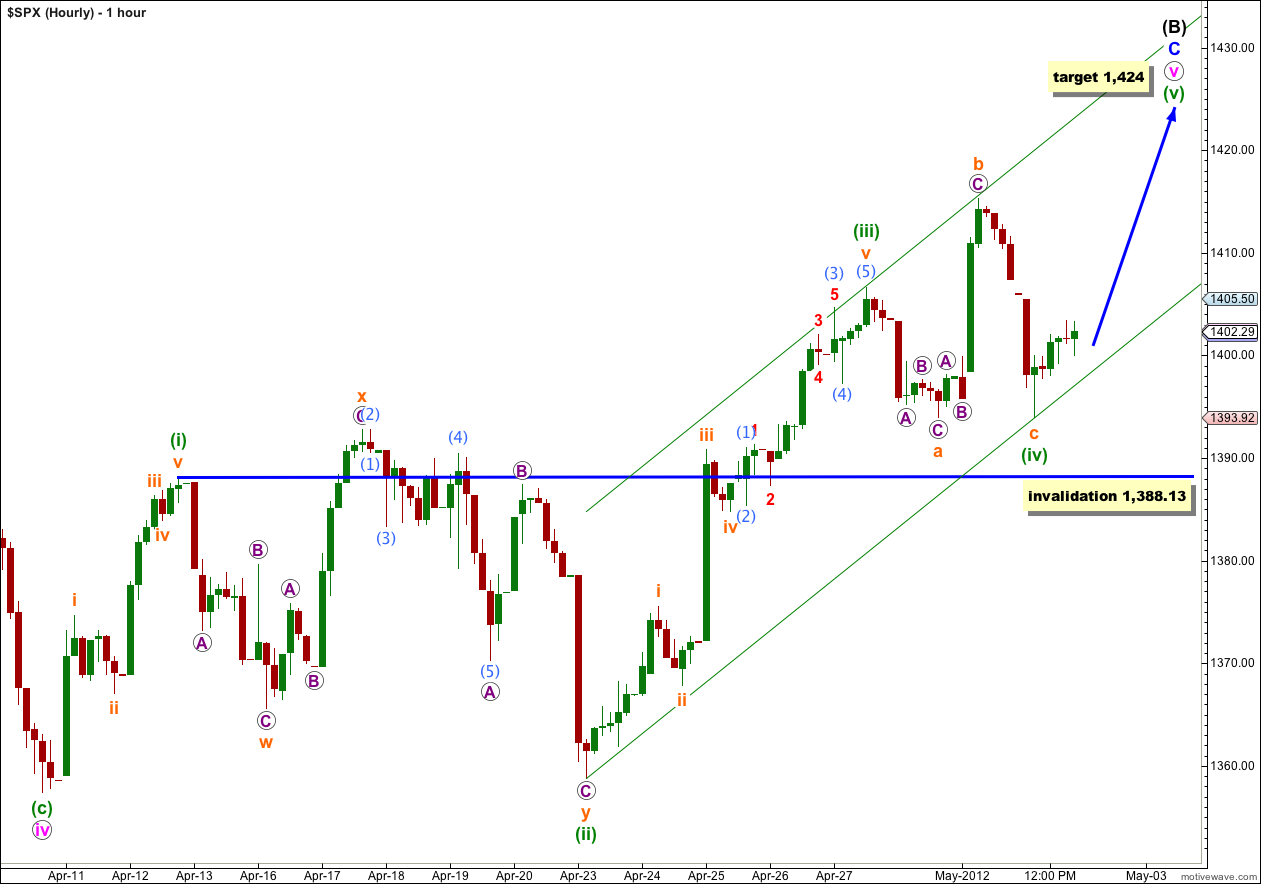
This wave count has an excellent and typical look, and agrees with MACD. Wave (iii) green is just 1.9 points short of 1.618 the length of wave (i) green.
Wave (ii) green may be over as a shallow flat correction where wave c orange is just 0.95 longer than 1.618 the length of wave a orange.
When we use Elliott’s second channeling technique about the impulse of wave v pink, the first trend line from the lows of (ii) to (iv) green and a parallel copy placed upon the high of wave (iii), this channel contains recent upwards movement perfectly. Wave (v) green should end either midway within the channel, or as the target suggests, at the upper end of the channel.
When this channel is clearly breached with downwards movement then we may expect that wave v pink could be over.
Any further extension of wave (iv) green may not move into wave (i) green price territory. This wave count is invalidated with movement below 1,388.13. If this wave count is invalidated with downwards movement then we may expect that the second wave of the alternate below is extending.
Alternate Hourly Wave Count.
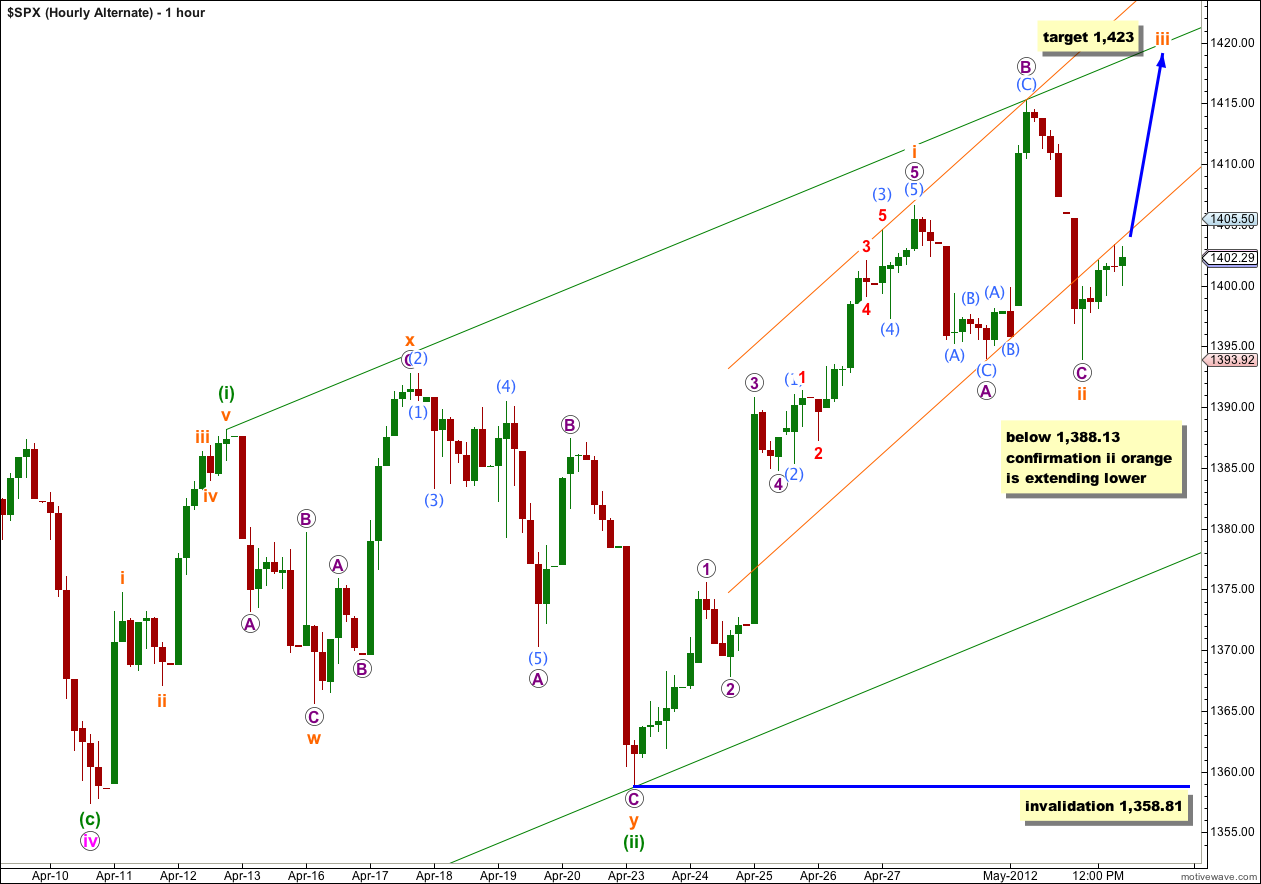
This alternate has a much lower probability than the main hourly wave count above, and if it is correct then the probability that ii orange would continue lower is low because as it is now it looks proportional.
At 1,423 wave iii orange would reach 0.618 the length of wave i orange.
Any further extension of wave ii orange may not move beyond the start of wave i orange. This wave count is invalidated with movement below 1,358.81.
Alternate Daily Wave Count.
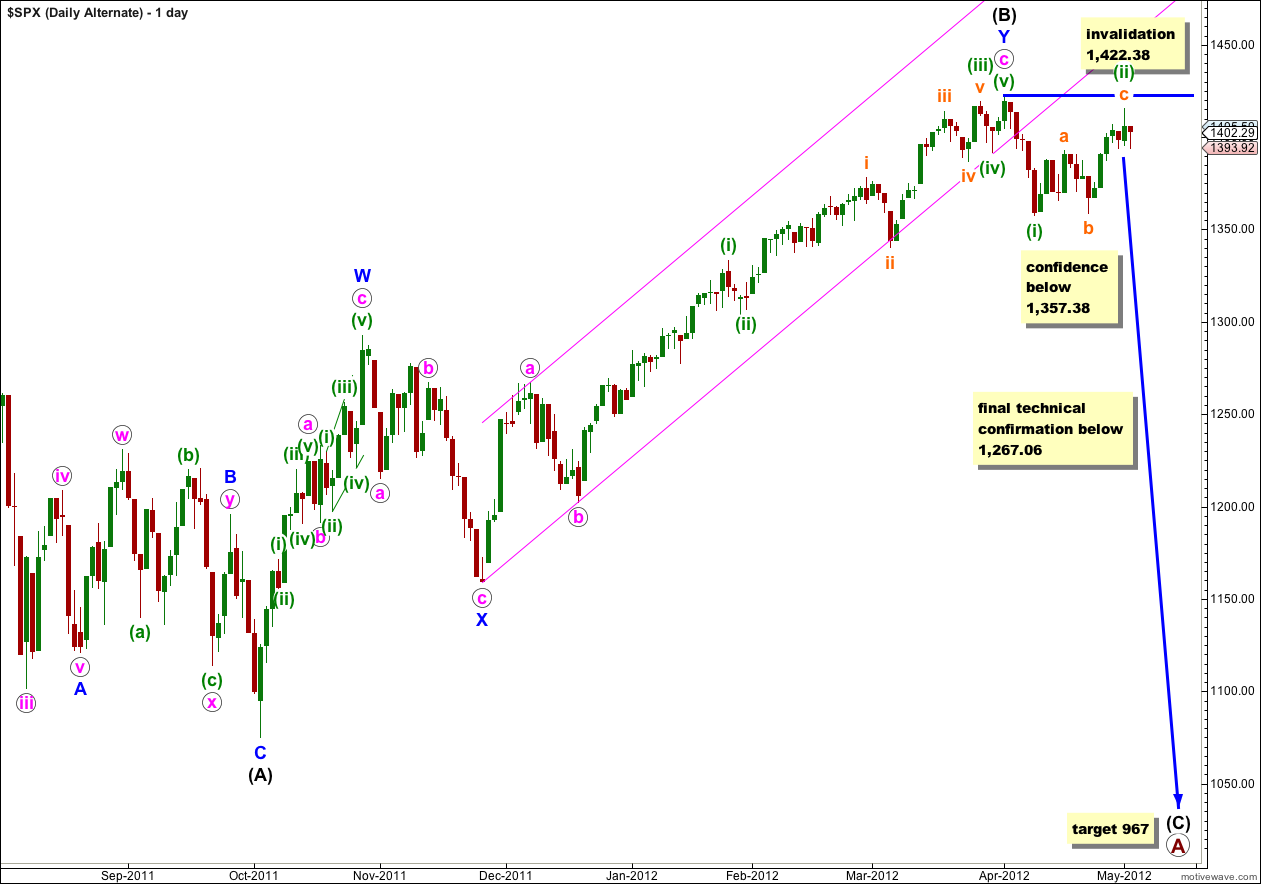
This wave count is now our alternate, and with the Dow invalidating its equivalent wave count during Tuesday’s session I expect this wave count will be invalidated very soon with upwards movement.
We need to see price move below 1,357.38 to invalidate our main wave count and confirm this alternate before we may have confidence that the S&P 500 has had a trend change. While price remains above that point our main wave count will remain viable and new highs possible.
You are right … I like the new channel line off the bottom and today’s low hit the top of your old channel line too.
Thank you.
yeah, that channel should continue to hold price until this structure is complete. so even if I get the prediction of direction wrong, as I did here, we can use the channel to show us where price should stop.