
Price has moved higher which was not what last analysis expected. With the Dow invalidating its main wave count with upwards movement it now looks like the alternate wave count for both markets is correct.
We should expect the trend to continue towards the target. When the structure is complete we may expect a trend change.
Click on the charts below to enlarge.
Main Wave Count.
Although our other wave count remains valid this wave count has significantly increased in probability today with strong upwards movement. I am switching wave counts because the Dow has invalidated what was its main count with upwards movement, and I expect tomorrow the S&P 500 will do the same.
I had considered that this wave count had a lower probability mainly because the subdivisions within A blue do not fit well. However, on the hourly chart a five wave impulse can be seen within iii pink of A blue, and this wave count is possible. Sometimes low probability wave counts occur. The problem is that when they do one never expects them to. That is the nature of probability.
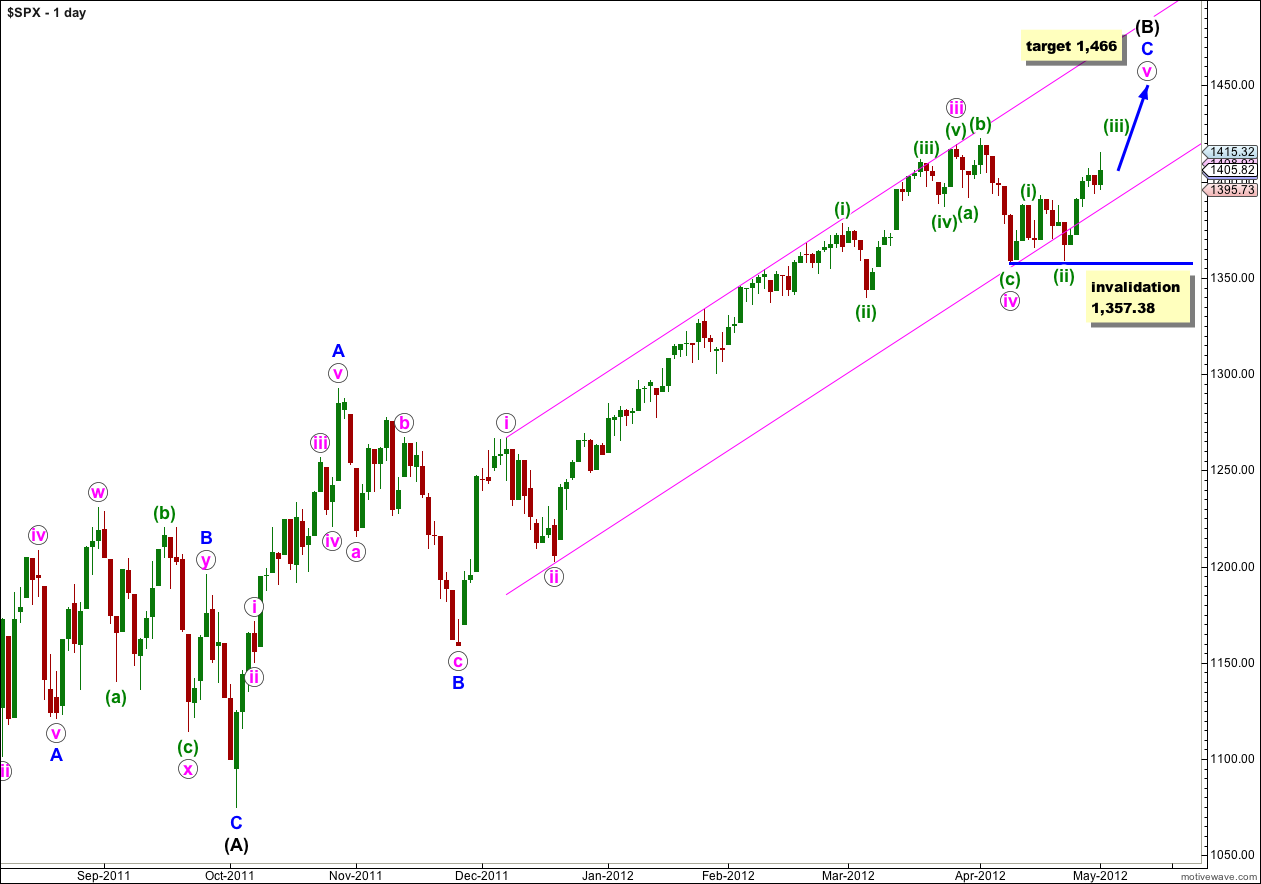
At 1,466 wave v pink would reach equality with wave i pink.
At primary degree wave A is an expanded flat correction. Within this expanded flat the maximum common length for wave (B) black would be 138% of wave (A) black at 1,464. Our target takes price right up to this point.
Within wave v pink any second wave may not move beyond the start of the first wave. Movement below 1,357.38 (prior to wave v completing) would invalidate this wave count and confirm our alternate.
When wave v could be considered complete then movement below 1,357.38 will confirm a big trend change.
The end of wave (B) black is probably at least two weeks away now, if not longer.
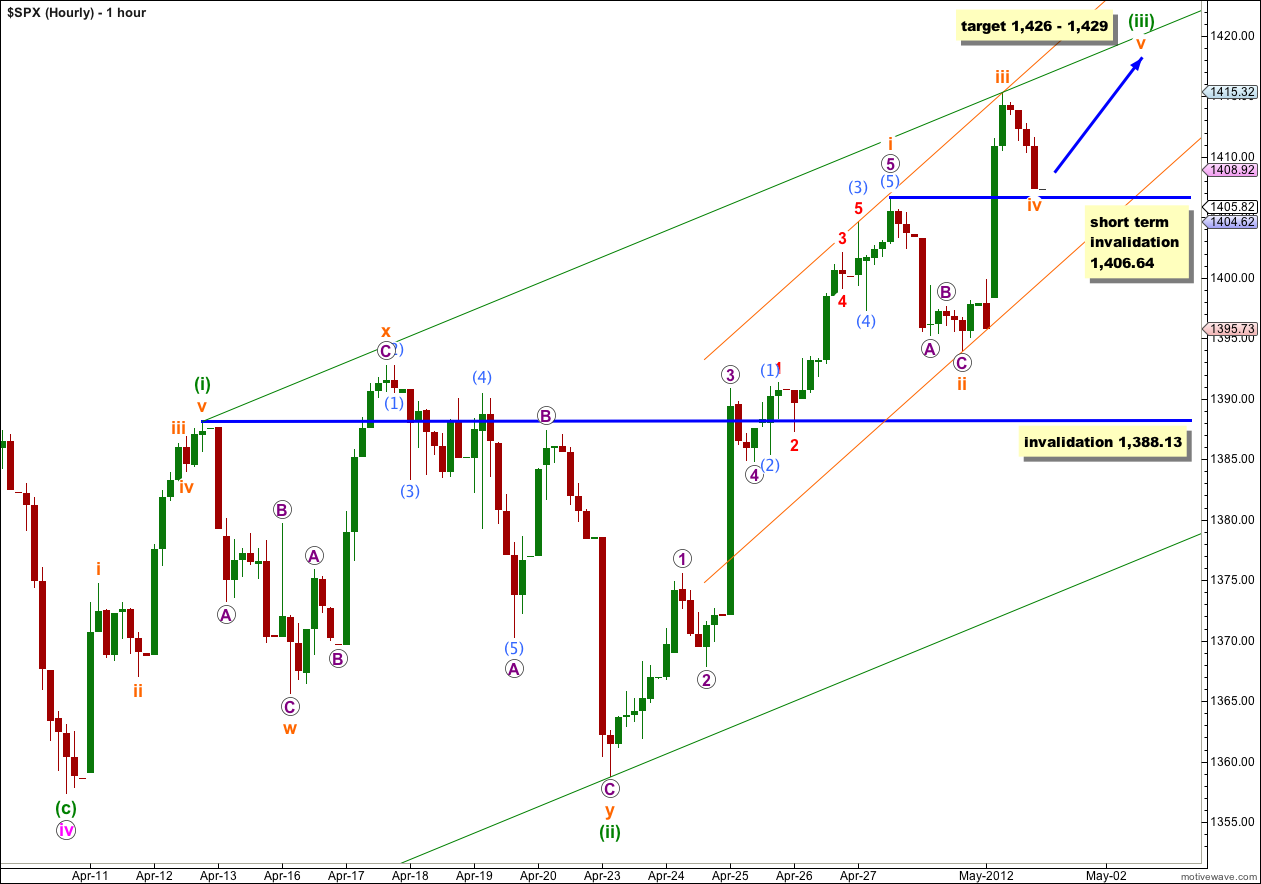
Within most recent upwards movement it looks like a third wave upwards is developing. The first wave looks most like it has extended.
There is no Fibonacci ratio between waves iii and i orange.
Ratios within wave i orange are: wave 3 purple has no Fibonacci ratio to wave 1 purple, and wave 5 purple is 1.09 points short of equality with wave 3 purple.
Within wave 5 purple there are no Fibonacci ratios between waves (1), (3) and (5) aqua.
Ratios within wave (3) aqua are: wave 3 red is just 0.86 points short of 2.618 the length of wave 1 red, and wave 5 red is just 0.49 points longer than equality with wave 1 red.
Wave ii orange within wave (iii) green was a very shallow 26% correction of wave i orange. We would expect wave iv orange to be a relatively deep correction of wave iii orange and far it has reached 38% of wave iii orange, and has no room left for further movement.
Wave iv orange may not move into wave i orange price territory. This wave count is invalidated with movement below 1,406.64 (prior to wave v orange completing). If this short term invalidation point is breached before we see a fifth wave upwards tomorrow then the alternate hourly chart below will be used.
At 1,426 wave (iii) green would reach 1.618 the length of wave (i) green. At 1,429 wave v orange would reach equality with wave i orange. This gives us a 3 point target zone for wave (iii) green to end.
We may use Elliott’s channeling technique to draw a small channel about this third wave of (iii) green. Expect wave v orange to end mid way within this channel.
We may also use Elliott’s channeling technique to draw a parallel channel about wave v pink in its entirety. When wave (iii) green is complete the channel should be steeper. This channel may show us where an upcoming fourth wave correction should end.
Alternate Hourly Chart.
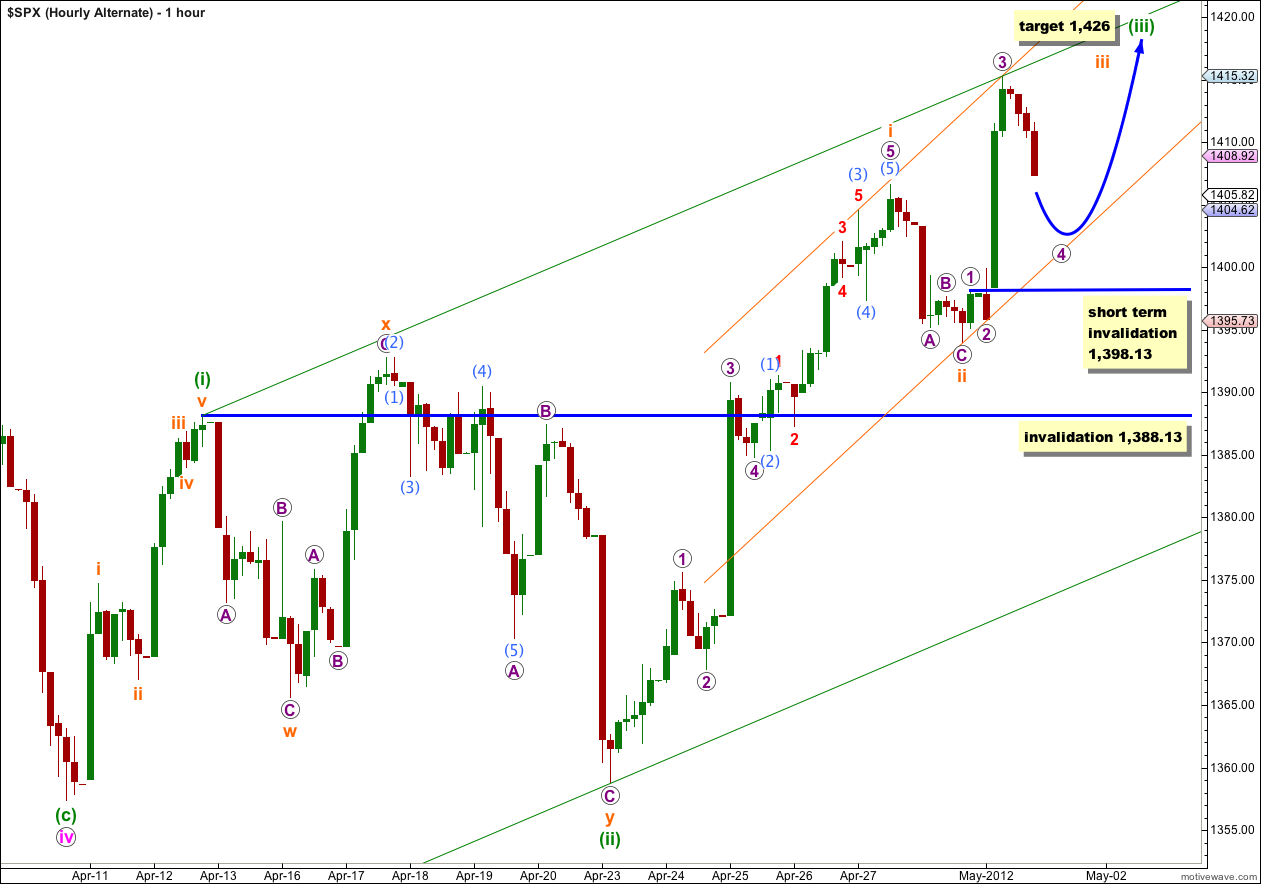
Alternatively within wave iii orange this structure may be incomplete. This alternate differs from the main hourly wave count only in the structure within wave iii orange.
If wave iii orange is incomplete then downwards movement at the end of Tuesday’s session may be a fourth wave correction. Wave 4 purple may not move into wave 1 purple price territory. This wave count is invalidated with movement below 1,398.13.
This wave count has a lower probability than the main hourly chart because on the 5 minute chart the subdivisions within wave iii orange fit very well as a complete five wave impulse, and not as well as two impulses.
Alternate Daily Wave Count.
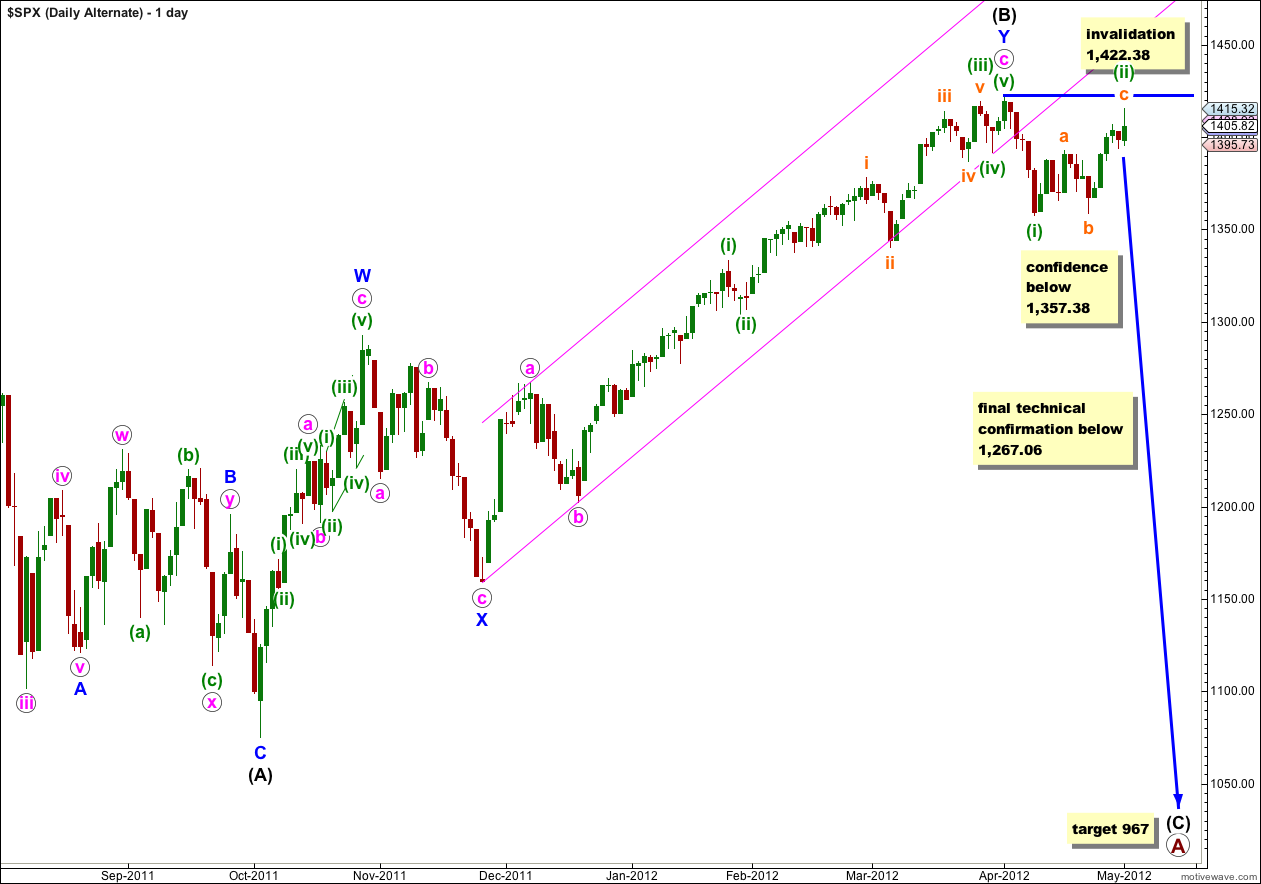
This wave count is now our alternate, and with the Dow invalidating its equivalent wave count during Tuesday’s session I expect this wave count will be invalidated very soon with upwards movement.
We need to see price move below 1,357.38 to invalidate our main wave count and confirm this alternate before we may have confidence that the S&P 500 has had a trend change. While price remains above that point our main wave count will remain viable and new highs possible.
What do you think about back testing the 61.8% Fib about 1380 (IHS) then we push a lot higher?
I have two new wave counts on the hourly chart for you today. I thin the main one will answer this question. It looks good.
Thank you!!
Building head and shoulders 60min 1406.64 KEY with very big bearish divergence on the NYMO too.
Its this or that or SOMETHING else How can the invester make a directional move??
Yes it is true that lately there have been alternates and it’s turned out that the alternates were correct.
However, it’s not always like this.
Sometimes the market situation is unclear. Sometimes it’s more clear. When it’s unclear then it may be better to step back and wait for clarity. It’s the trades that professional investors don’t take which often sets them apart from trades that others make.
When my analysis is unclear then your own technical indicators may show you what direction is more likely. If my main wave count aligns with your own analysis then you have a more likely direction to trade in.
a-b-c ratios on alternate daily makes more sense. I think we will go down.