
Yesterday I had a strong expectation of downwards movement for Wednesday’s session, which is not what we have seen. Price has reentered the parallel channel on the alternate chart.
Both our main and alternate wave counts remain valid. The sideways movement of the last several days has not provided any clarity at all. We need to see price break out of this range to illuminate which wave count is more likely.
Click on the charts below to enlarge.
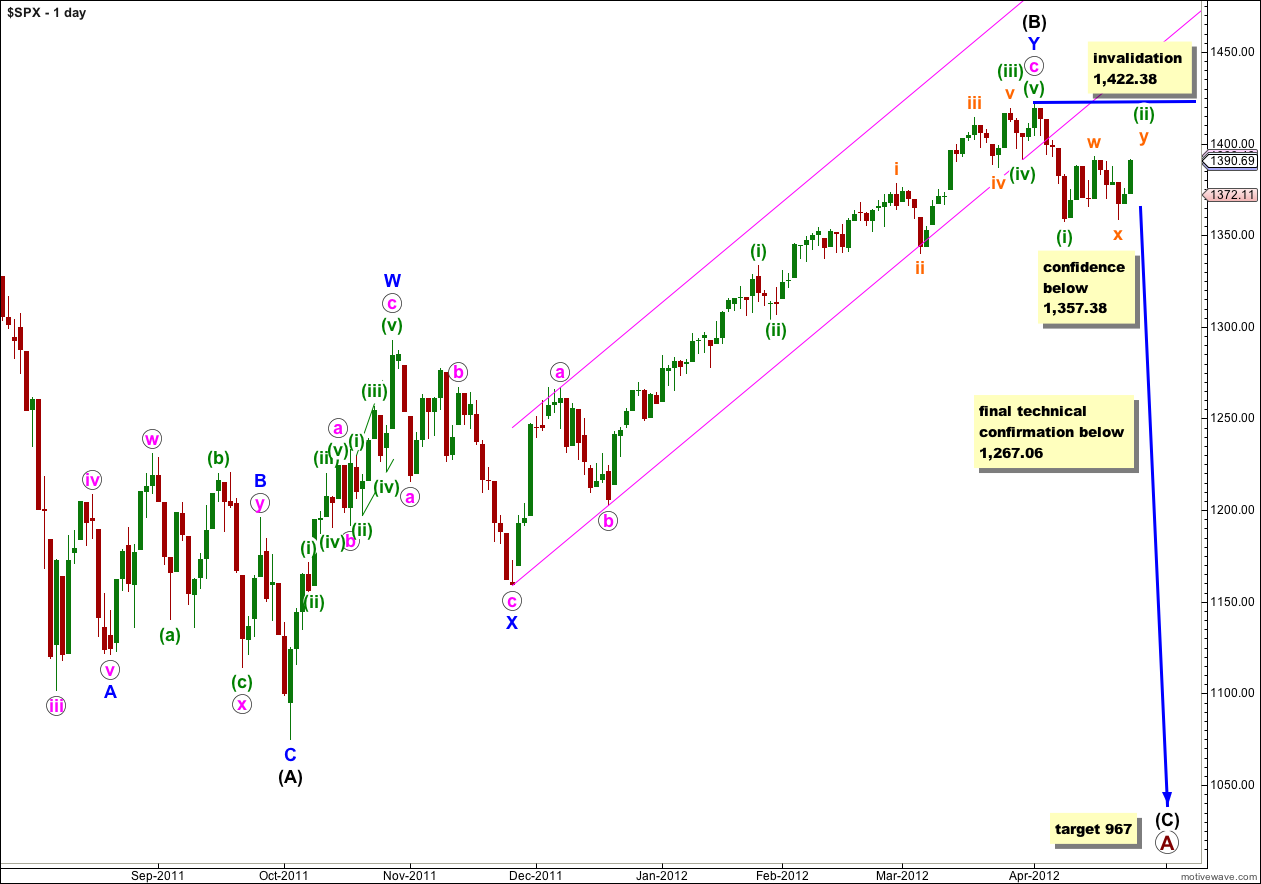
Price remains below 1,422.38 and this wave count remains not only valid but still has a higher probability than our alternate.
Movement below 1,357.38 would add significant confidence to this wave count. At that stage I will discard the alternate.
At primary degree wave A would be an expanded flat correction because wave (B) black is a 123% correction of wave (A) black. We would expect wave (C) black to most likely reach 1.618 the length of wave (A) black a 967. If price moves through this first target then the next (less likely) target would be where wave (C) black reaches 2.618 the length of wave (A) black at 685.
Main Hourly Wave Count.
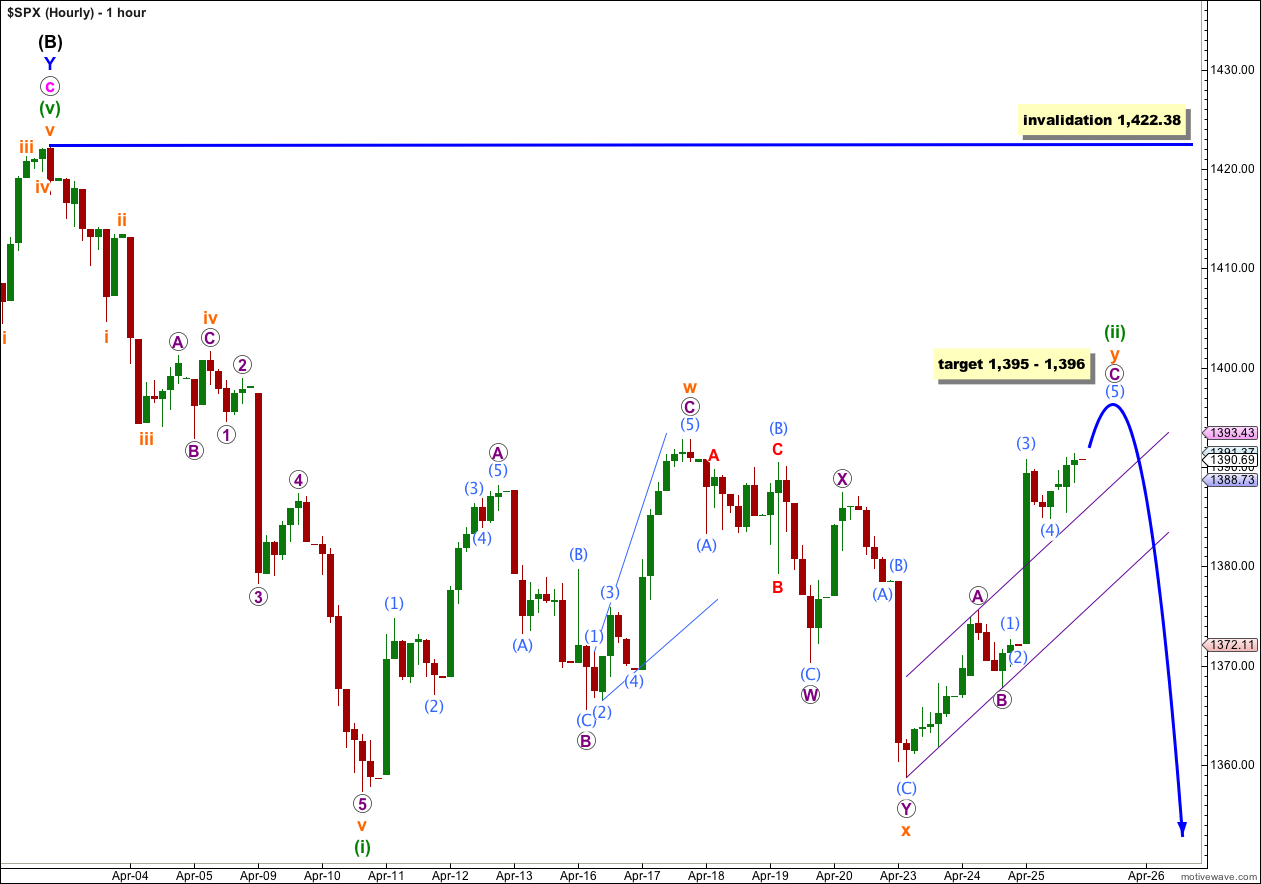
I have looked at several different possibilities and an extension of wave (ii) green is the only wave count I can see (so far) in which all subdivisions fit and it meets all Elliott wave rules and guidelines.
It looks like wave (ii) green is continuing as a large exaggerated double combination or double zigzag structure.
The downwards wave labeled x orange looks like a five, but it is not an impulse and it cannot be a diagonal because the second wave would be a flat and this violates a rule- second waves within diagonals must be zigzags. This structure fits better as a double zigzag.
Within wave (ii) green wave y orange would be completing as a zigzag (most likely) or possibly as a flat or triangle. If it is a zigzag then at 1,395 wave (5) aqua would reach 0.618 the length of wave (3) aqua, and at 1,396 wave C purple would reach 1.618 the length of wave A purple.
Using Elliott’s technique to draw a parallel channel about wave y orange shows this channel breached by upwards movement. Sometimes C waves do this, as they have properties and behaviour of third waves. When this channel is breached by downwards movement then wave y orange will be over and the next movement downwards should be underway.
Wave (ii) green may not move beyond the start of wave (i) green. This wave count is invalidated with movement above 1,422.38.
Alternate Hourly Wave Count.
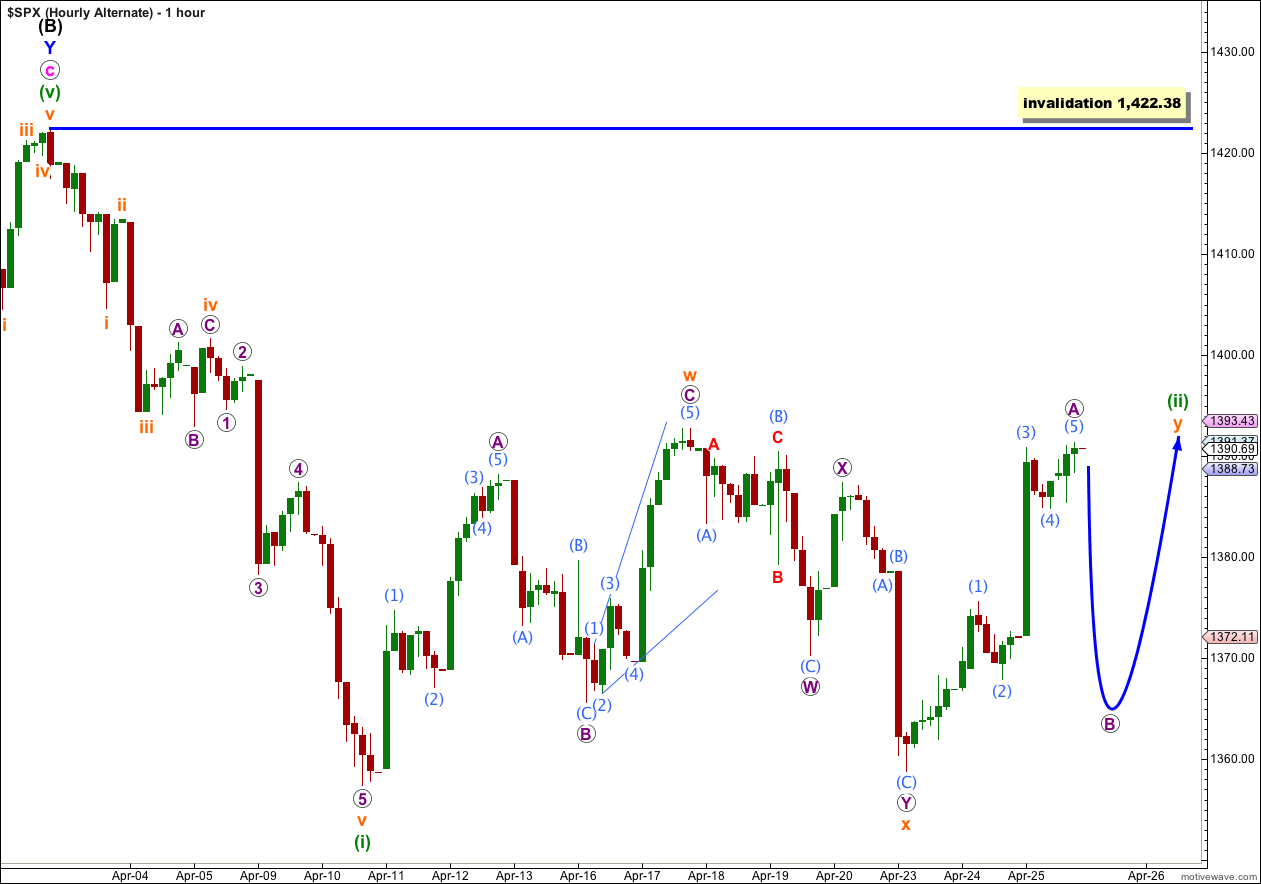
Within wave y orange of the double of wave (ii) green wave A purple may be only just or almost complete. If wave y orange unfolds as a triangle then wave B purple may make a new low beyond the start of wave A purple at 1,358.79. Wave B purple must subdivide into a zigzag. If wave y orange unfolds as a zigzag then wave B purple may not make a new low beyond the start of wave A purple.
The main difference to take from this alternate compared to the main hourly wave count is that this alternate expects a longer lasting and more sideways movement. Wave y orange could take a week or more to unfold.
The invalidation point is the same. This alternate has about an equal probability with the main hourly wave count.
Alternate Daily Wave Count.
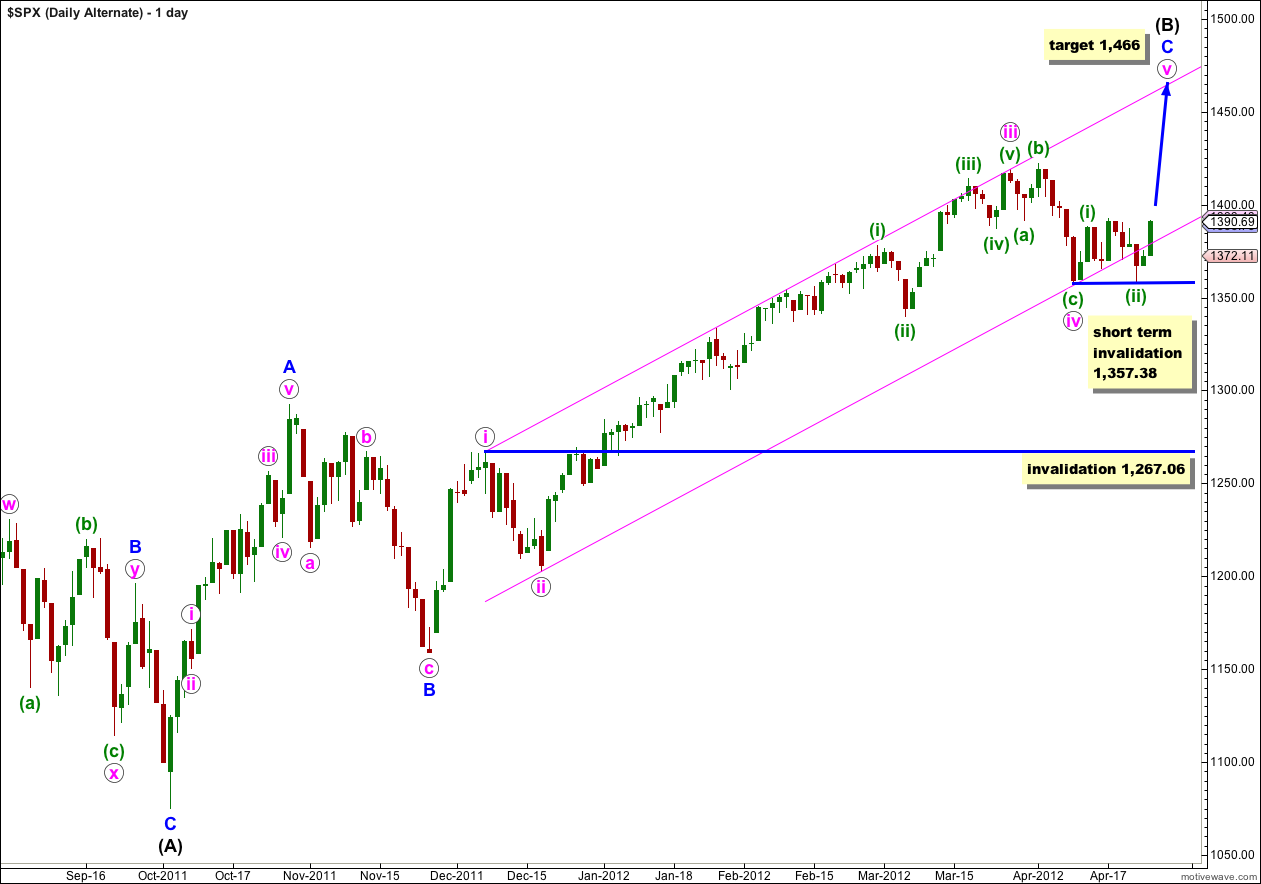
I did not expect price to reenter this parallel channel as it looked like the lower edge of the channel would provide resistance.
With price reentering this channel and the breach being very small and now unconvincing, this wave count remains valid. However, the subdivisions do not have nearly as good a fit as the main wave count, particularly within the upwards wave labeled here A blue within (B) black. This reduces the probability of this wave count.
Although the channel breach is unconvincing it is still a breach and this also reduces the probability of this wave count.
Within wave v pink waves (i) and (ii) green would be complete. Within wave (ii) green wave C of this flat does not subdivide into a five wave structure, and as a very rare triple (in which the subdivisions would fit) it has the wrong look. This also reduces the probability of this wave count.
We need to see movement below 1,357.38 before we can discard this wave count. Wave (ii) green may not move beyond the start of wave (i) green. At that point this wave count would be initially invalidated.
Any further extension of wave iv pink may not move into wave i pink price territory. This wave count would be finally invalidated with movement below 1,267.06.
Done …. it should be on the way
Thank you.
Working on a count that has 1422.38 was Wave-B, 1357.38 Wave-C, 1392.76 Wave-D, and 1358.79 Wave-E of a triangle and the bottom of a Major Wave-4. Which makes this push up to 1402 minor wave-1 putting Major Wave-5 target just over 1440
With the bullish divergence on the McClellan Oscillator (NYMO) pushing it up.
Do you think I could be on the right road???
Thank you.
would you be able to email me a chart please? that would be so much easier to see what you mean
admin@elliottwavestockmarket.com
thank you Karen!
Dear Lara, If wave C is 2 times wave A, could we accept that within the ratios (equality)? If so can we say the last circled A-B-C structure on hourly wave count completed? Because on last candlestick pair in hourly chart there is a bearish engulfing pattern. RSI and Stochastics are also started to turn down from Overbought Arena. On the other hand, it’s sad that market is moving up just because there’s a speech somewhere, not because of the economic datas.
I have found that ratios between A and C waves are unreliable. Ratios within impulses of 1, 3 and 5 are more reliable.
I have a wave count today which looks very good and sees this corrective movement as complete. I have an alternate which has a lower probability and sees more sideways movement.
I cannot see the bearish engulfing pattern you mention on the hourly chart though?
http://i46.tinypic.com/34j7r6t.jpg
seems our data sources are different.
Minor Wave-2 would it go down about 20 points?
HOD 1400.84 taking some gain
We are outside +2 deviations from the top of the channel off the bottom.
Thank you for the channel idea!!
Second waves are usually deep and usually correct to about 0.618 of the first wave, or as in this case, much deeper. I expect you are referring to the green (i) and (ii) waves on the alternate daily chart which are now complete?