
As our main wave count expected the S&P 500 has continued to move lower.
Price reached down to touch the lower edge of the parallel channel on the daily chart of our alternate wave count. Although this wave count has a low probability, it is still possible. If it is correct we would expect upwards movement from here. If it is incorrect then the channel should be breached within the next few days, if not tomorrow. A strong and significant channel breach of our alternate wave count would be strong confirmation that our main wave count is correct.
Click on the charts below to enlarge.
With Tuesday’s session giving strong downwards movement the idea that we have had a large trend change is strengthened. This wave count is looking very good.
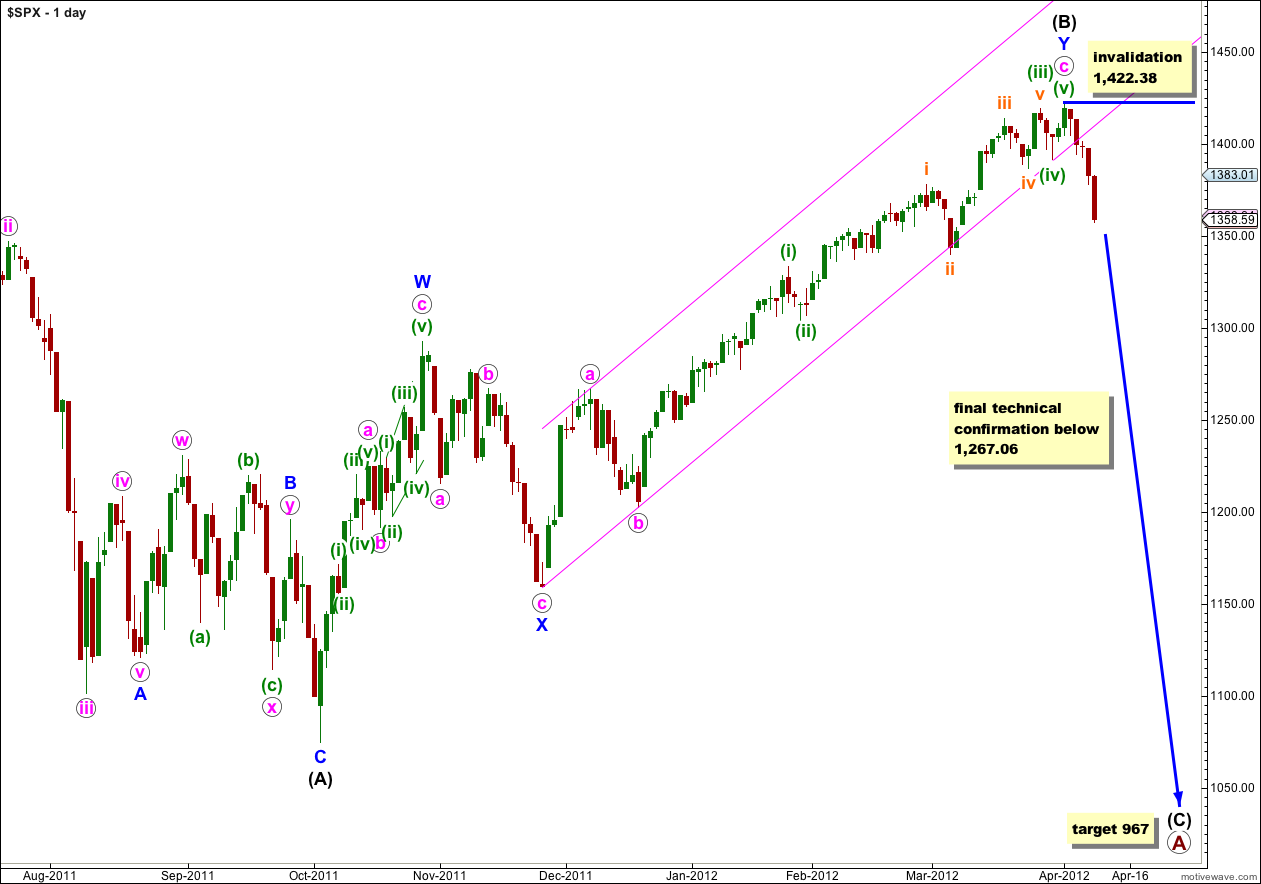
At primary degree wave A would be an expanded flat correction because wave (B) black is a 123% correction of wave (A) black. We would expect wave (C) black to most likely reach 1.618 the length of wave (A) black a 967. If price moves through this first target then the next (less likely) target would be where wave (C) black reaches 2.618 the length of wave (A) black at 685.
Within wave (C) black no second wave correction may move beyond the start of its first wave. This wave count is clearly invalidated with any movement above 1,422.38.
This wave count has a typical look for wave c pink. The third wave is extended which is most common, and its subdivisions can be seen clearly on the daily chart which should be expected. It agrees with MACD in that within wave c pink the strongest reading is for the third wave.
Wave (B) black is a double zigzag structure which is a common structure. Within the first zigzag labeled W blue the subdivisions fit most neatly as a zigzag.
If the channel on the daily chart for the alternate wave count below is breached then we may have significantly increased confidence in this wave count. Movement below 1,267.06 would finally and technically confirm a large trend change.
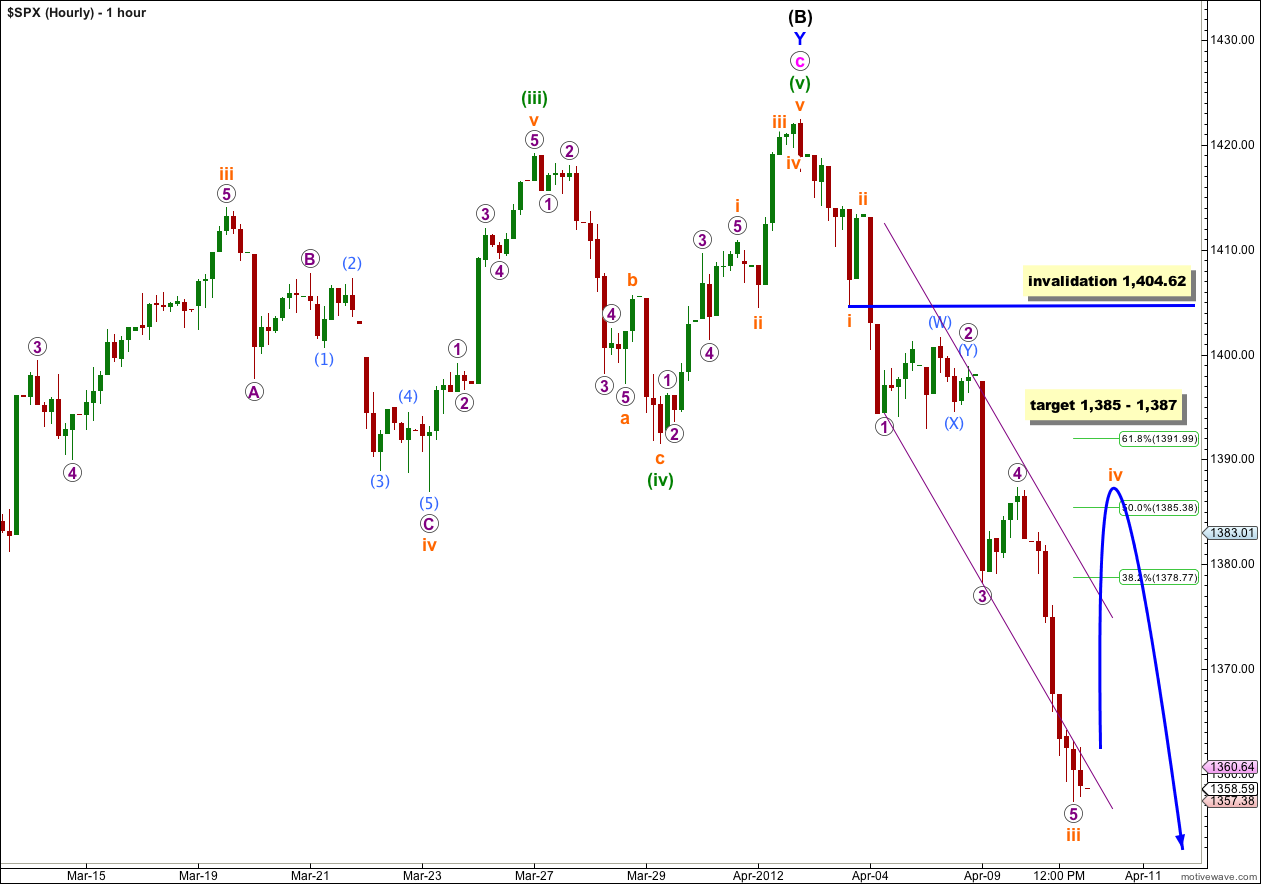
This was our main hourly wave count yesterday, which expected an extended third wave to complete.
The target was 1,367 – 1,368. This was passed quickly and exceeded by 10 points.
Wave iii orange has no Fibonacci ratio to wave i orange. We may expect therefore that wave v orange to come is extremely likely to exhibit a Fibonacci ratio to either of i or iii orange.
Ratios within wave iii orange are: wave 3 purple is 1.6 points longer than equality with wave 1 purple, and wave 5 purple is 0.85 points short of 1.618 the length of wave 1 purple.
If wave iii orange is complete then wave iv orange may breach the small purple parallel channel containing it tomorrow.
Our expectation for wave iv orange is about the fourth wave of one lesser degree at 1,387, which is just above the 50% level of wave iii orange at 1,385. It does not have to be this deep, but this is the most likely point for it to reach.
Wave iv orange may not move into wave i orange price territory. This wave count is invalidated with movement above 1,404.62.
Alternate Daily Wave Count.
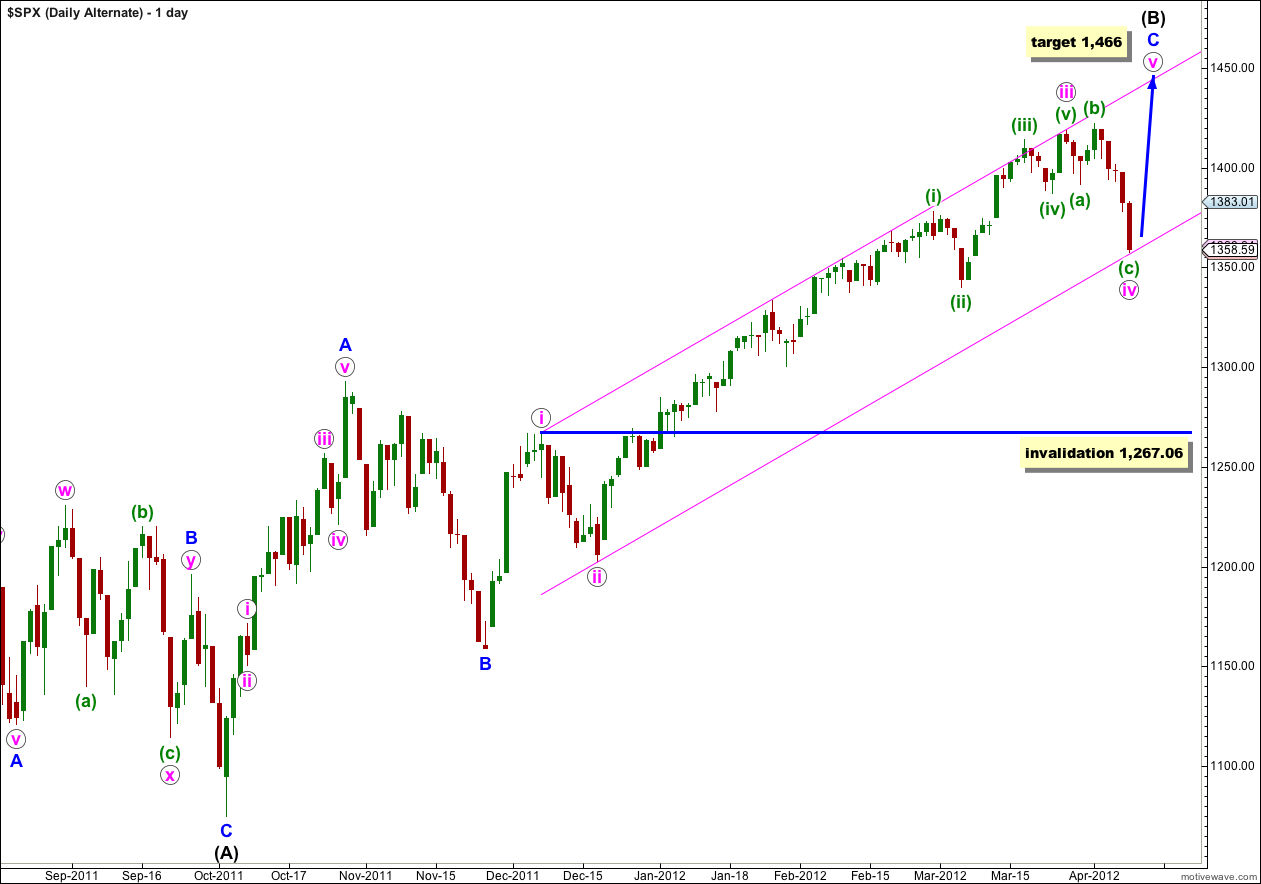
If the upwards wave labeled A blue here subdivides into a five then wave (B) black may be a single zigzag structure. This wave count has a fairly low probability because this wave subdivides most easily into a three, and it is difficult (but possible) to see it as a five. As a five it has a strange looking third wave which reduces the probability of this wave count.
However, we should consider the implications of the parallel channel about wave C blue. This channel has been so nicely held to on the upper edge all along this long sustained rise, and until this channel is breached by downwards movement I want us to consider the possibility that we may yet see a final fifth wave up to new highs.
Within wave iv pink wave (c) green is now almost perfectly 1.618 the length of wave (a) green. Wave (b) green was a 112% correction of wave (a) green, and this is a very typical expanded flat correction, so far.
At 1,466 wave v pink would reach equality with wave i pink.
If price continues lower tomorrow then the probability of this wave count will reduce. Look out for support about the lower edge of this pink parallel channel.
Wave iv pink may not move into wave i pink price territory. This wave count is invalidated with movement below 1,267.06. However, in practice I would discard this wave count before price gets that low, as a strong and significant breach of the parallel channel containing wave C blue would reduce the probability of this wave count.
Lara,
Based on the structure and duration of A black and B black in our main count, can you make any assumptions or predictions about the structure and duration of C black?
I can try to guess, but that’s all it would be, a guess.
Fibonacci time relationships are not that reliable. Price ratios are much more reliable.
I would guess (C) black should last months.
Wave (A) black was 62 days, wave (B) black was exactly twice the duration at 124 days. Wave (C) black could be 62 days, equal to (A), or 77 days, 0.618 the duration of (B) black. Or it may be neither.