
Yesterday’s analysis expected upwards movement as most likely from the S&P 500. Price has moved lower but remains above the invalidation point on the hourly chart.
We still have two hourly wave counts which diverge in their expectation of the next movement. The situation is a little unclear. We may use confirmation / invalidation points to work with these two wave counts tomorrow.
The long upwards wave which began on 19th December 2011 has many subdivisions within it, and there are multiple ways to count this wave. The best approach at this stage is to use a parallel channel drawn using Elliott’s technique to indicate when this movement is over.
Click on the charts below to enlarge.
With Wednesday’s strong downwards movement this wave count remains valid but it looks less likely today. There are several ways to count wave c pink, and at the end of this analysis I present yet another possibility. I can see even more, but because of the multiple alternates available the best approach to this market at this stage is to expect that the trend remains the same, until proven otherwise. The possibility of further upwards movement and new highs will remain until we have confirmation of a trend change.
We shall only have confirmation of a trend change when we can see a full daily candlestick below the pink parallel channel here, and not touching the lower trend line. That is, a clear breach of the channel.
The labeling here of green subdivisions within wave c pink agrees with MACD, as does our new alternate below.
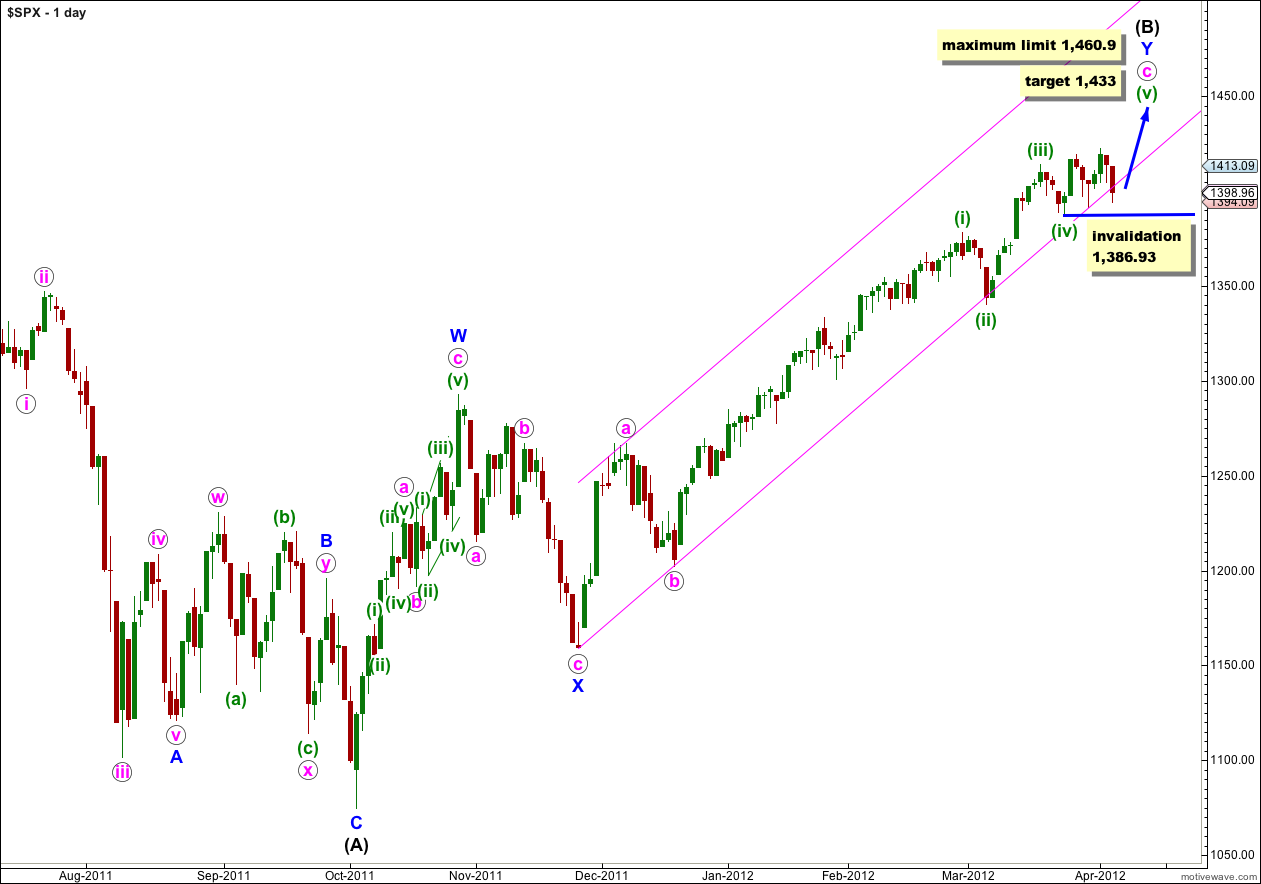
This wave count sees the S&P 500 as within a final fifth wave upwards to complete a large correction at intermediate (black) degree. If wave Y blue is to have a Fibonacci time relationship then it may take another 1 session to complete, lasting 90 days (just one over a Fibonacci 89). Please note though that Fibonacci time relationships are not as reliable as price ratios, and this expectation of another 1 session is a rough guide only.
Wave (iii) green is shorter than wave (i) green. Because third waves may never be the shortest wave this gives us a limit to upwards movement for wave (v) green as no longer than equality with wave (iii) green at 1,460.9.
Wave (B) black is correcting the three wave structure of wave (A) black within a flat correction at primary degree. The maximum common length for wave (B) black in relation to wave (A) black is 138%. This would be achieved at 1,464 and it is likely we shall see a trend change before this price point is reached.
Wave (v) green would reach 0.618 the length of wave (iii) green at 1,433.
Within wave (v) green no second wave correction may move beyond the start of the first wave. This wave count is invalidated with movement below 1,386.93.
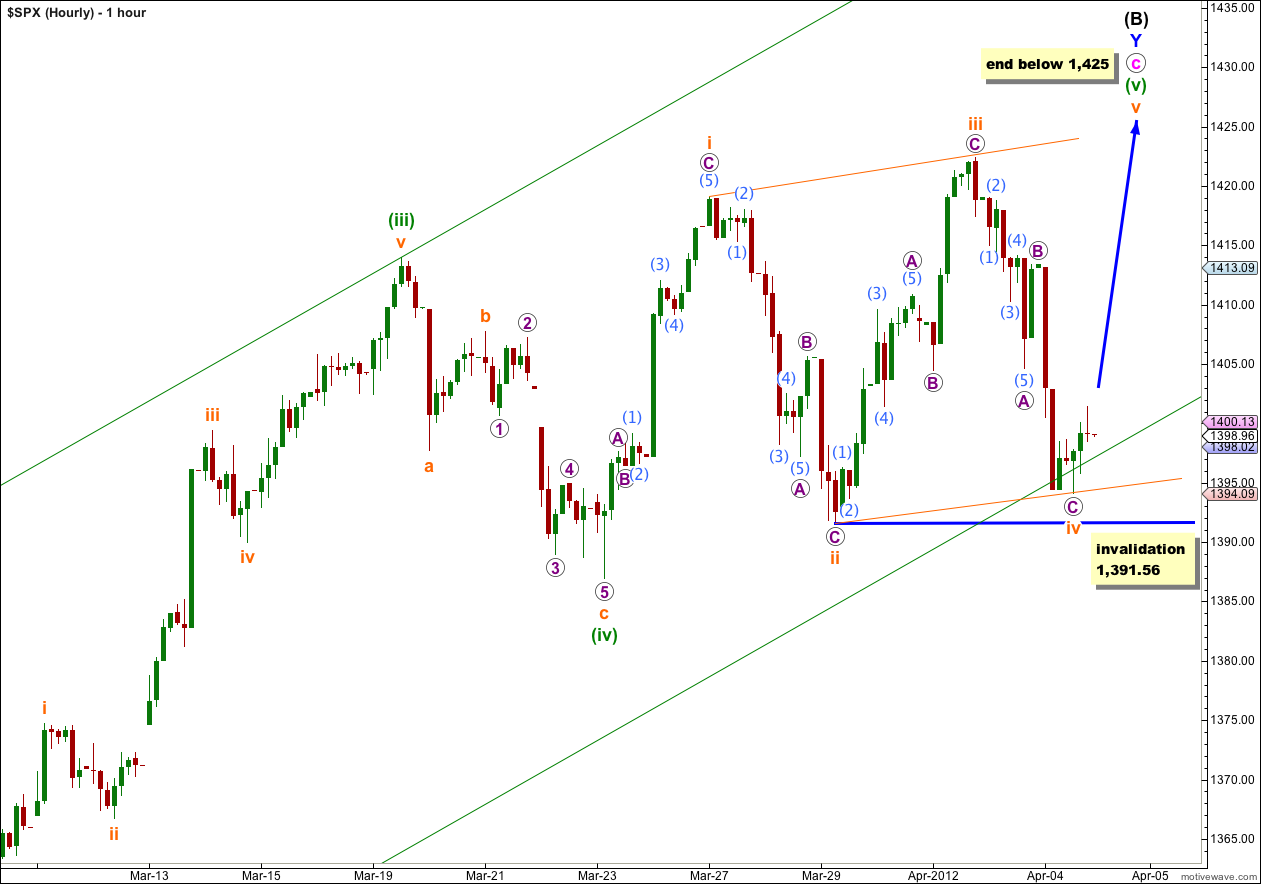
The possible ending diagonal has significantly reduced in probability with Wednesday’s downwards movement.
The diagonal should be contracting because wave iii orange is slightly shorter than wave i orange. But now wave iv orange is longer than wave ii orange.
I have seen a reasonable number of diagonals where the wave lengths are not as expected, and which in hindsight were most probably diagonals. As long as the third wave is not the shortest sometimes the second and fourth waves do not conform to expectations. However, when this happens as a diagonal is unfolding it significantly reduces the probability that the structure is correct.
Within a diagonal wave iv orange may not move beyond the end of wave ii orange. Movement below 1,391.56 would firmly invalidate this wave count.
At that stage we may use the alternate hourly wave count below.
However, if downwards movement continues tomorrow to take price outside of the pink parallel channel on the daily chart then we must consider the possibility that upwards movement is over and the S&P 500 may have seen a major trend change.
Alternate Hourly Wave Count.
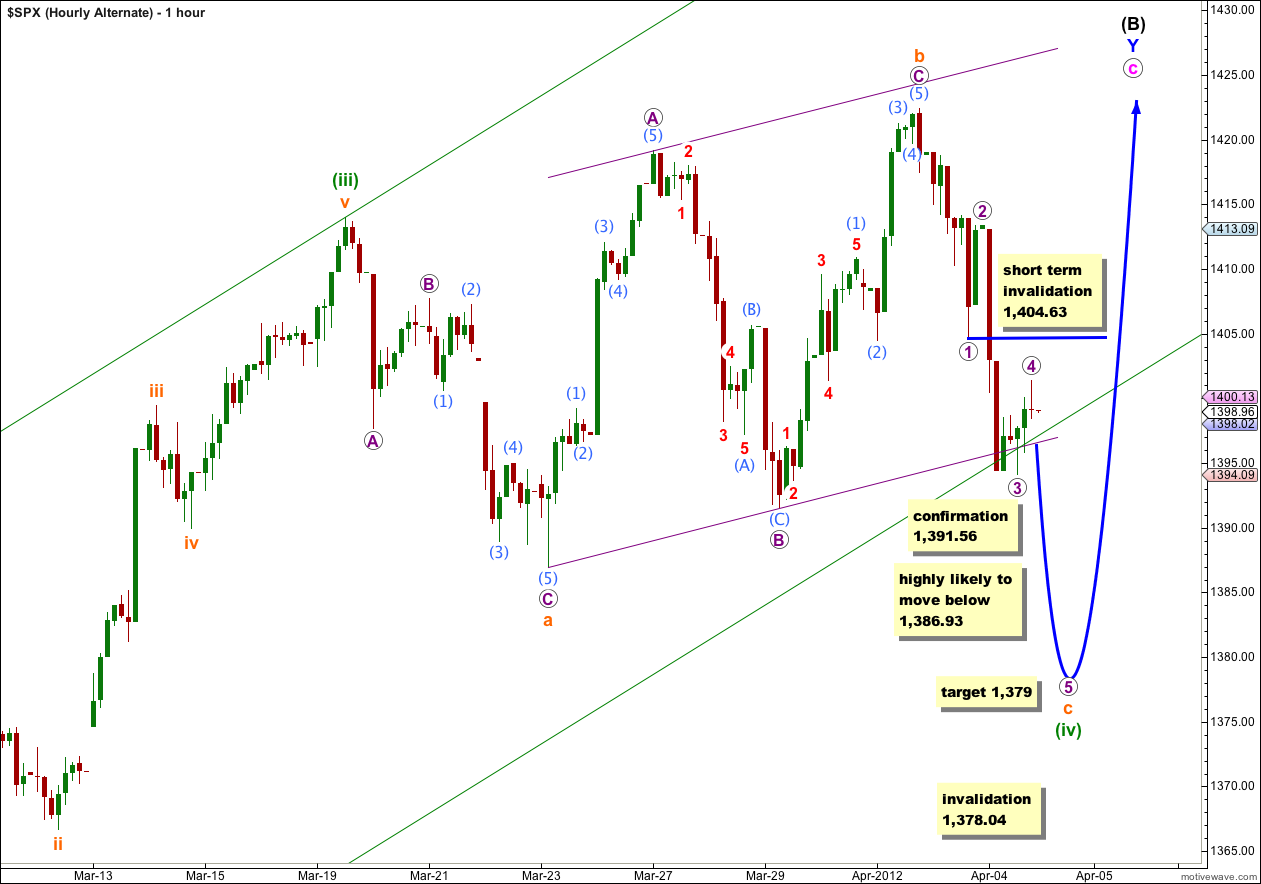
At this stage I consider this alternate hourly wave count to have about an equal probability with the main hourly wave count.
This wave count requires movement outside of the pink parallel channel on the daily chart though, without having a major trend change, as only a fourth wave. This would look very strange on the daily chart. For this reason I consider this alternate wave count to also have a low probability.
So far downwards movement from the high labeled b orange is in three waves. This alternate needs to see it continue further as a five wave impulse for wave c orange.
Movement below 1,391.56 would invalidate the main hourly wave count and confirm this alternate.
At that stage we may expect it is highly likely price would continue lower below the low labeled a orange at 1,386.93 because an expanded flat normally has a C wave which moves beyond the end of the A wave.
At 1,379 wave c orange would reach 1.618 the length of wave a orange. This would end wave (iv) green expanded flat.
Wave (iv) green may not move into wave (i) green price territory. This alternate is invalidated with movement below 1,378.04.
Alternate Daily Wave Count.
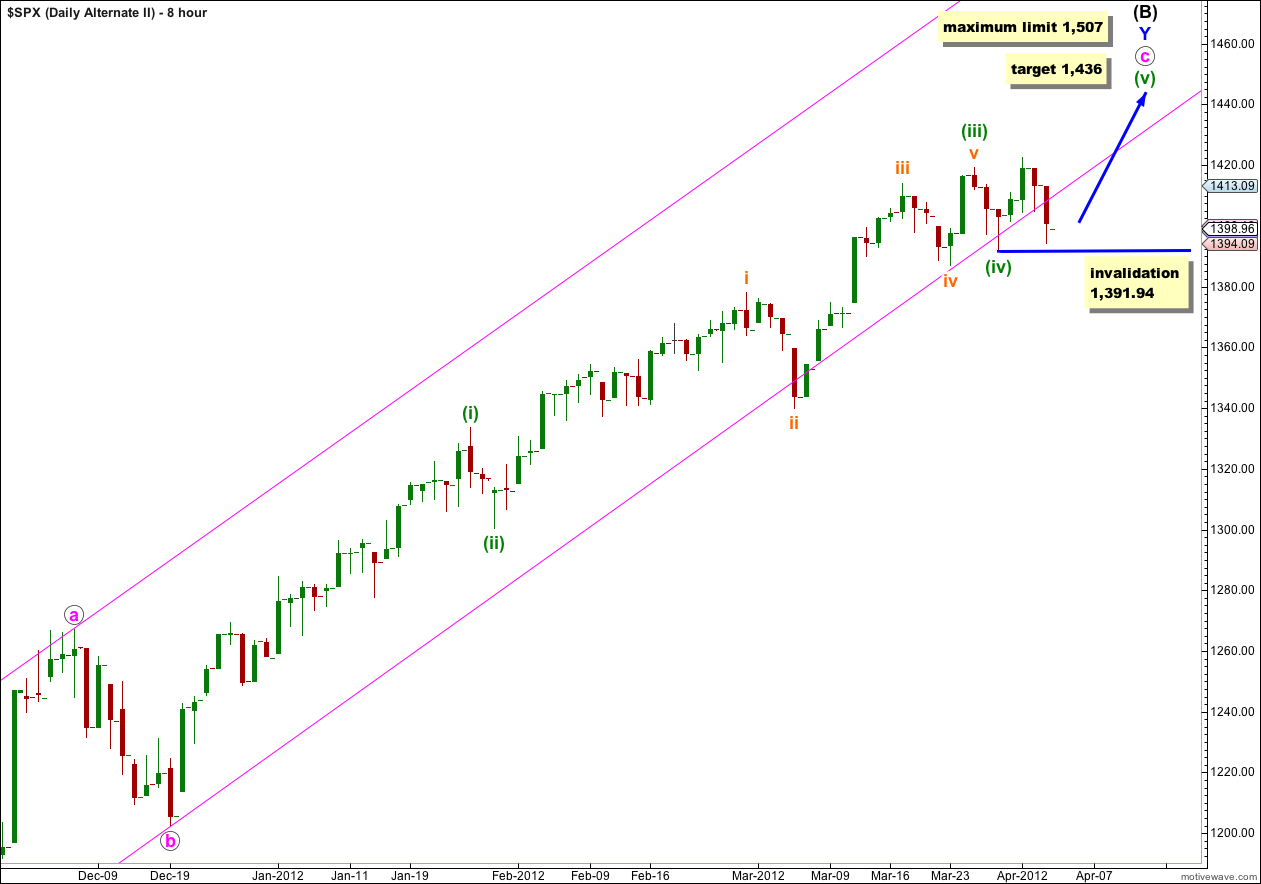
I will show this wave count on an 8 hour chart to more clearly illustrate the subdivisions within wave c pink.
This wave count is exactly the same as the main wave count up to wave c pink. This alternate wave count also agrees with MACD in that the strongest reading is within wave (iii) green.
For this alternate wave (v) green may be unfolding as an ending diagonal with only waves i and ii orange complete. It may require another week or so of upwards movement.
Wave (iii) green is shorter than wave (i) green and has no Fibonacci ratio to it. This makes it more than likely that wave (v) green would exhibit a ratio to either of (i) or (iii) green. At 1,436 wave (v) green would reach 0.382 the length of wave (iii) green.
Wave (v) green may not be longer than equality with wave (iii) green because the third wave may not be the shortest. This gives a maximum limit to upwards movement for this wave count to 1,507. However, we would certainly expect a trend change before that price point is reached.
Within wave (v) green wave ii orange may not move beyond the start of wave i orange. This wave count is invalidated with movement below 1,391.94.
Thanks Lara ,
Love it —-:)