
Movement below 1,410.8 invalidated our hourly wave count. The daily wave count remains valid.
I can see two possible explanations on the hourly chart, and we have two hourly wave counts today. We may use the invalidation / confirmation point to work with these wave counts tomorrow.
We have absolutely no confirmation of a trend change yet. We should expect this trend to continue towards calculated targets.
Click on the charts below to enlarge.
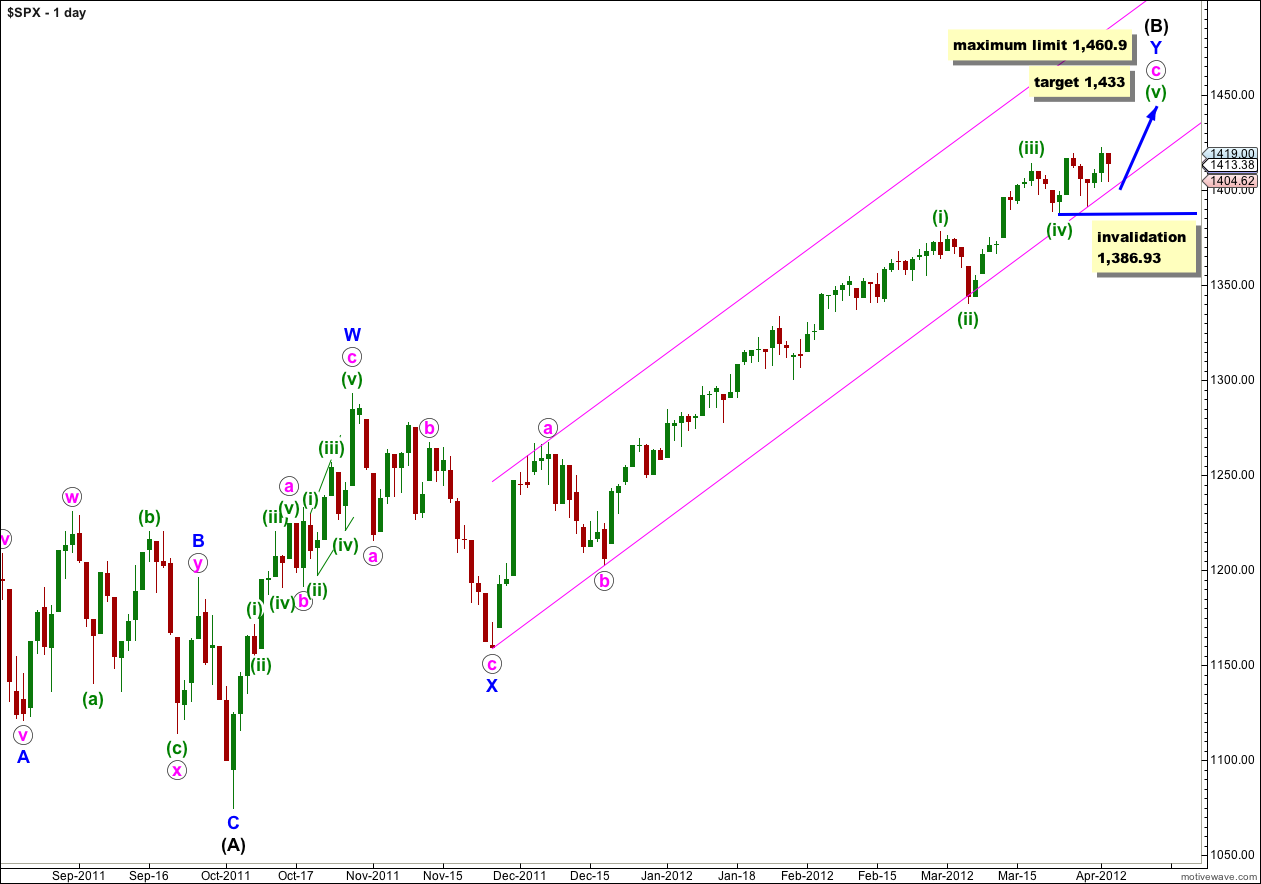
This wave count sees the S&P 500 as within a final fifth wave upwards to complete a large correction at intermediate (black) degree. If wave Y blue is to have a Fibonacci time relationship then it may take another 1 session to complete, lasting a Fibonacci 89 days. Please note though that Fibonacci time relationships are not as reliable as price ratios, and this expectation of another 1 session is a rough guide only. If the main hourly wave count is correct then wave (v) green could possibly end in one or two sessions. 89 days, plus or minus one day either side, is an acceptable Fibonacci relationship.
Wave (iii) green is shorter than wave (i) green. Because third waves may never be the shortest wave this gives us a limit to upwards movement for wave (v) green as no longer than equality with wave (iii) green at 1,460.9.
Wave (B) black is correcting the three wave structure of wave (A) black within a flat correction at primary degree. The maximum common length for wave (B) black in relation to wave (A) black is 138%. This would be achieved at 1,464 and it is likely we shall see a trend change before this price point is reached.
Wave (v) green would reach 0.618 the length of wave (iii) green at 1,433.
Within wave (v) green no second wave correction may move beyond the start of the first wave. This wave count is invalidated with movement below 1,386.93.
We should keep drawing the parallel channel on the daily chart about the zigzag of wave Y blue. Draw the first trend line from the start of Y blue to the low labeled b pink, then place a parallel copy on the high of a pink. Only when this channel is breached by a full daily candlestick below it shall we have confirmation of a big trend change, and until that time we should expect upwards movement to continue.
Main Hourly Wave Count.
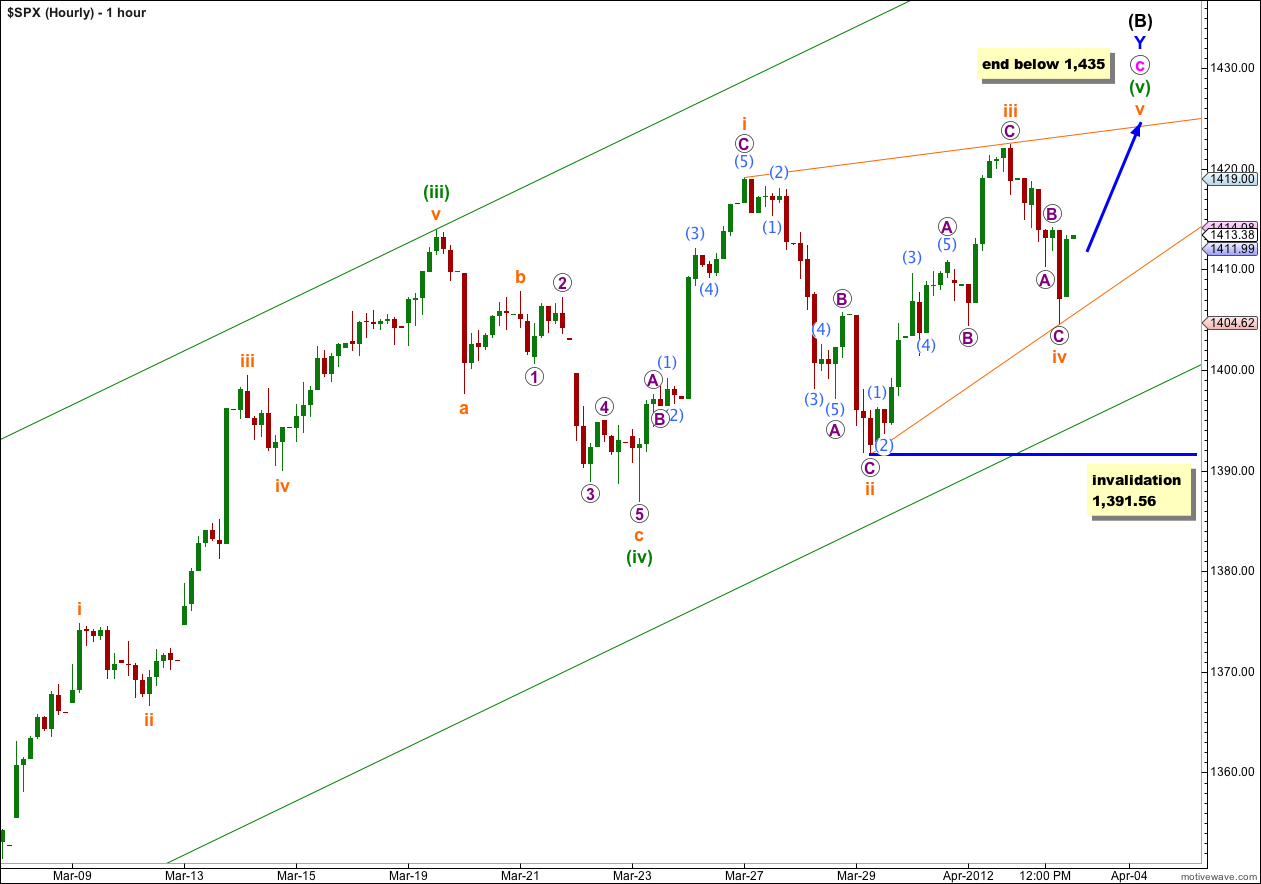
There are two structural options for wave (v) green: an impulse which was yesterday’s wave count (which was invalidated) or an ending diagonal.
The very choppy overlapping movement of the last few days suggests a diagonal may be unfolding. This wave count must see all waves since the end of (iv) green as zigzags, which has a better fit than the alternate and has a higher probability.
The diagonal would be contracting. Wave v orange may not be longer than equality in length with wave iii orange. This gives us a maximum limit to upwards movement at 1,435. We should expect wave v orange to end before price reaches this point.
Fifth waves of contracting diagonals often end about the 1-3 trend line. We may expect wave v orange to end about the upper orange trend line.
Within diagonals the fourth wave should overlap into the first wave price territory, but may not move beyond the end of the second wave. This wave count is invalidated with movement below 1,391.56.
If this wave count is invalidated with downwards movement (before wave v orange upwards is complete) then we should use the alternate hourly wave count below.
Alternate Hourly Wave Count.
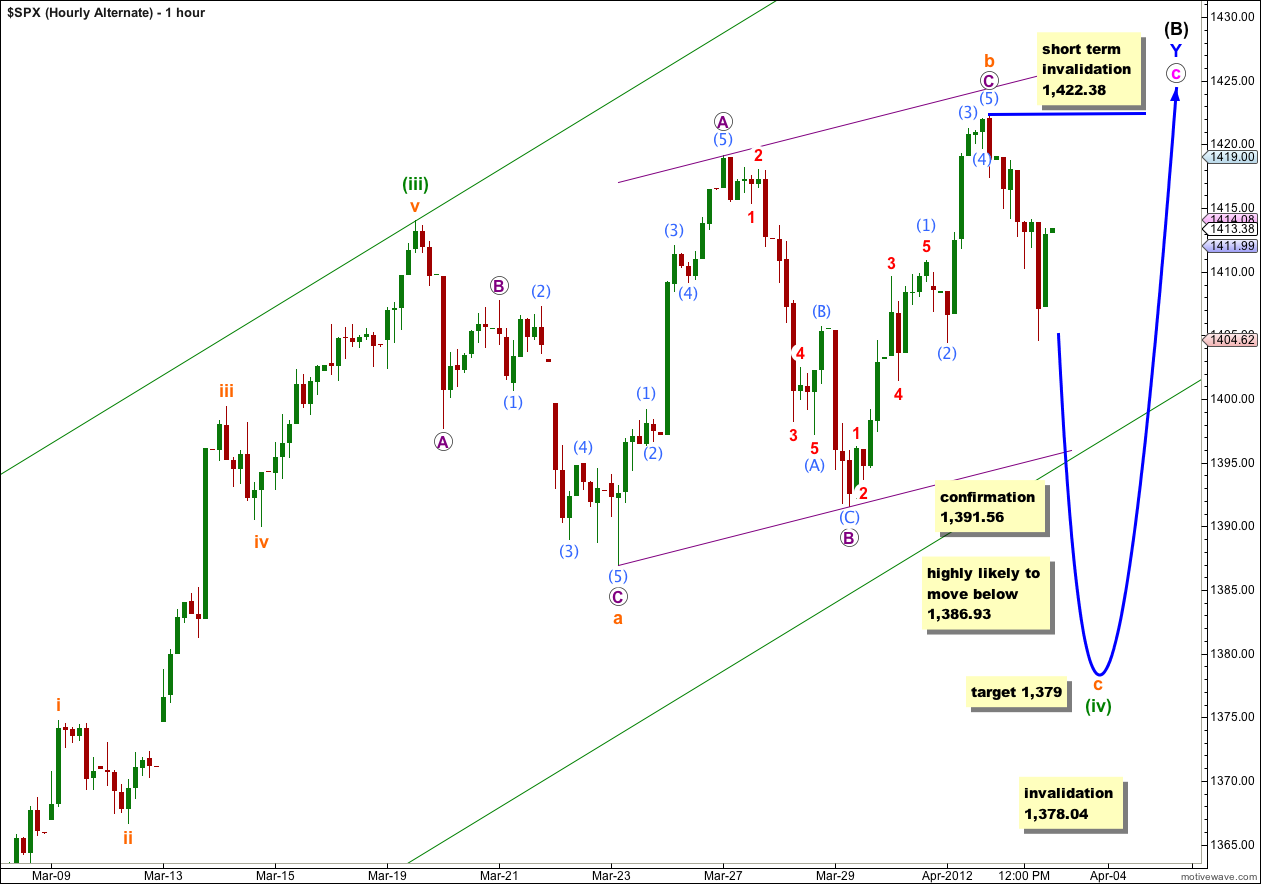
It is possible that the overlapping choppy movement of the last few days is a continuation of wave (iv) green as a flat correction (more likely) or a running triangle (less likely).
Wave b orange is a 131% correction of wave a orange. This indicates an expanded flat, and is within the typical length for a B wave in relation to A within a flat.
An expanded flat expects a C wave which moves substantially beyond the end of the A wave. It is highly likely that if this wave count is correct price would move substantially below 1,386.93.
At 1,379 wave c orange would reach 1.618 the length of wave a orange.
Within wave c orange no second wave correction may move beyond the start of its first wave. This wave count is invalidated in the short term with movement above 1,422.38.
Wave (iv) green may not move into wave (i) green price territory. This wave count is invalidated with movement below 1,378.04.
Alternate Daily Wave Count.
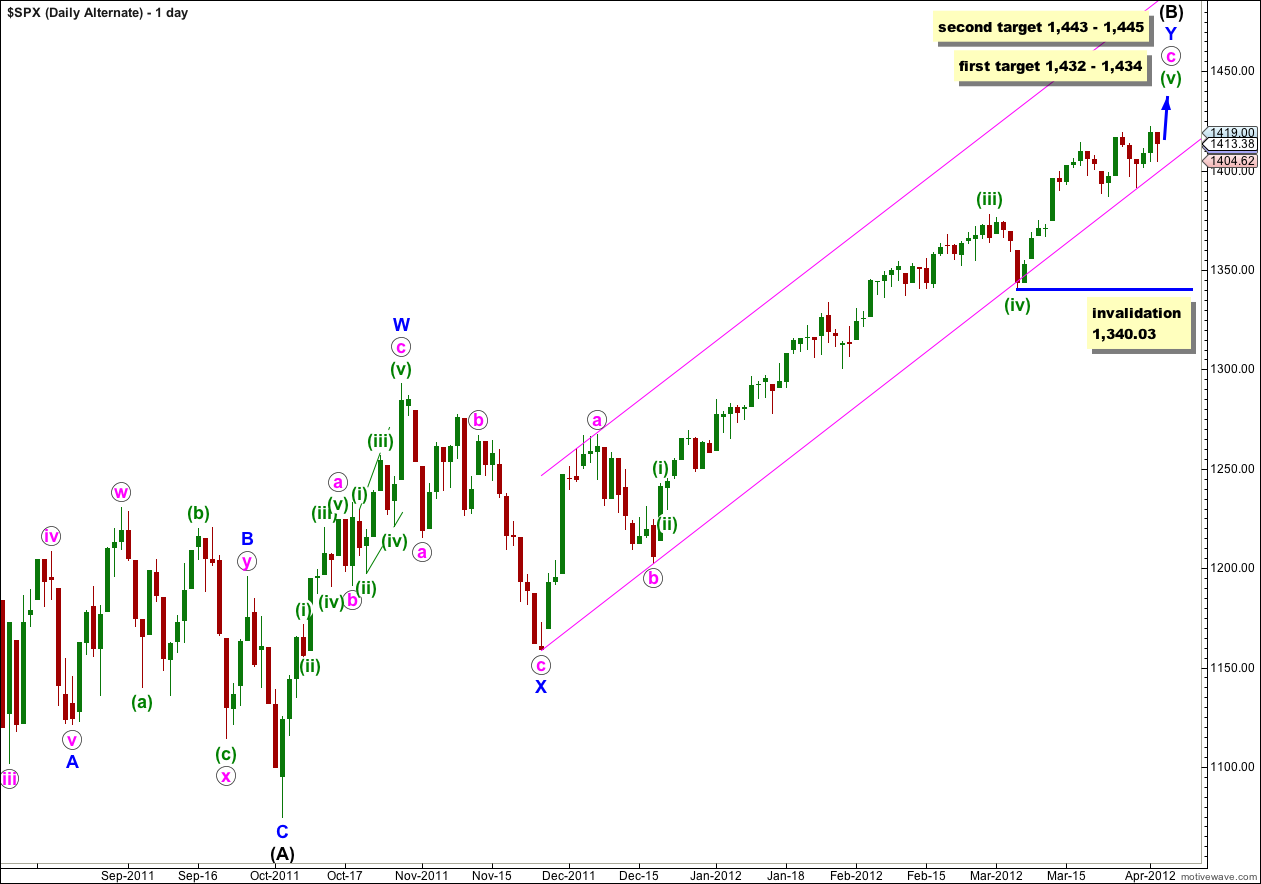
This alternate wave count also sees the S&P 500 within a final fifth wave up to complete a larger correction for (B) black. However, the labeling of green subdivisions within wave c pink does not agree with MACD and this wave count has a lower probability than the main wave count.
Within wave c pink wave (iii) green is longer than wave (i) green and there is no limit to upwards movement.
At 1,432 wave (v) green would reach 0.618 the length of wave (iii) green. At 1,434 wave v orange within wave (v) green would reach equality with wave iii orange. This is our first target for upwards movement to end.
If price continues through the first target, and the structure requires further upwards movement to complete it, the second target is at 1,445 where wave (v) green would reach 2.618 the length of wave (i) green. At 1,443 wave v orange within wave (v) green would reach 1.618 the length of wave i orange. This gives us a second two point target zone.
Within wave (v) green no second wave correction may move beyond the start of the first wave. This wave count is invalidated with movement below 1,340.03.
Nope. And unfortunately there are multiple alternate possibilities at this stage. I’ll have a new one in the next analysis.
I don’t think there’s a triangle unfolding here, it just does not look quite right. It would have to clearly breach the pink channel on the daily chart which would look really weird if it were a fourth wave.
Very nice looks like everything is holding to continue towards calculated targets.
Just a bigger triangle?