
The S&P 500 moved higher as we expected. It slightly exceeded our short term target at 1,401, which we expected to be reached within another one to three sessions.
Both our main and alternate wave counts expect exactly the same movement next as there is no divergence. Our long term targets remain the same.
Click on the charts below to enlarge.
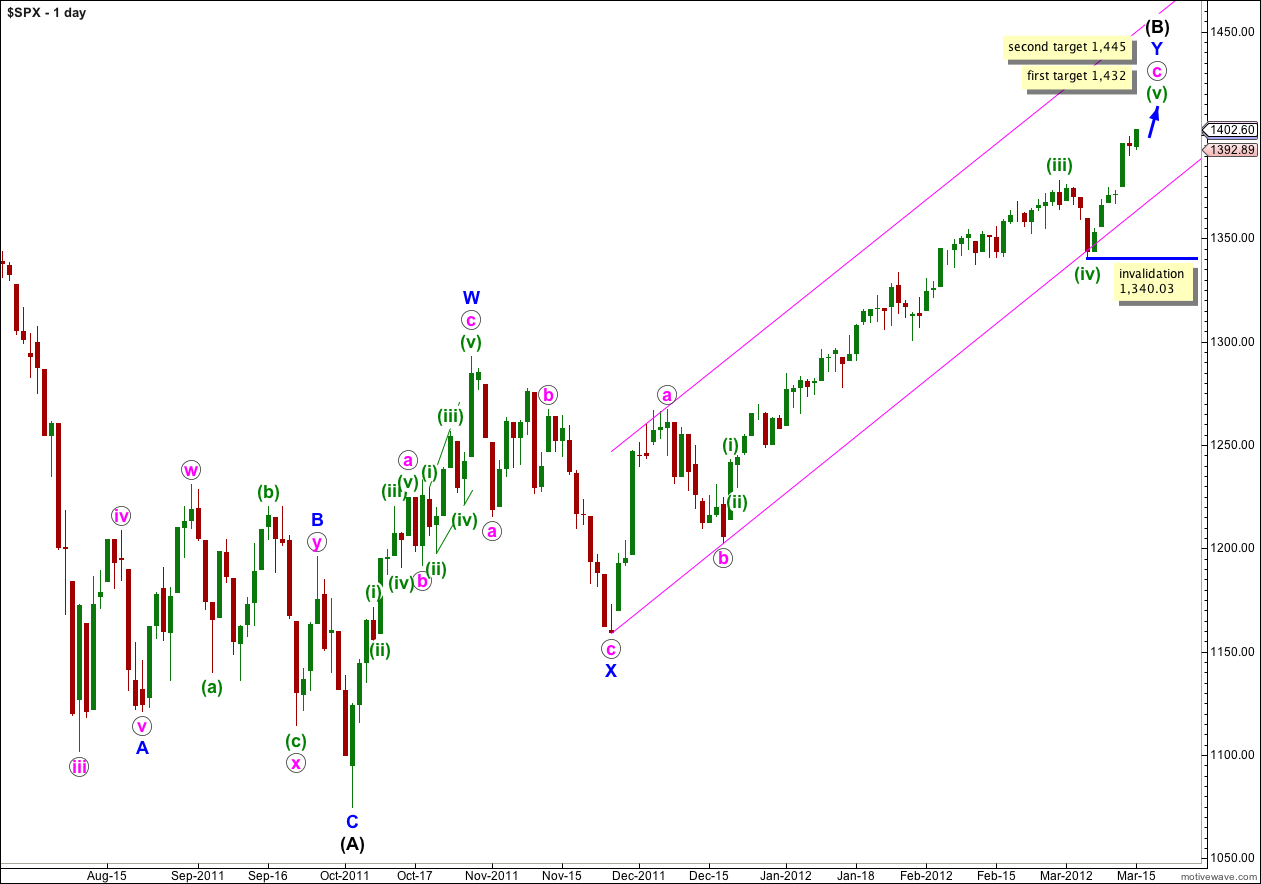
This main wave count, and our alternate below, both see the S&P 500 as within a final fifth wave upwards to complete a large correction at intermediate (black) degree. If wave Y blue is to have a Fibonacci time relationship then it may take another 14 sessions to complete, lasting a Fibonacci 89 days.
Wave (B) black is correcting the three wave structure of wave (A) black within a flat correction. The maximum common length for wave (B) black in relation to wave (A) black is 138%. This would be achieved at 1,464 and it is likely we shall see a trend change before this price point is reached.
At 1,432 wave (v) green would reach 0.618 the length of wave (iii) green. This is our first target for upwards movement to end.
If price continues through the first target, and the structure requires further upwards movement to complete it, the second target is at 1,445 where wave (v) green would reach 2.618 the length of wave (i) green.
Within wave (v) green no second wave correction may move beyond the start of the first wave. This wave count is invalidated with movement below 1,340.03.
We should keep drawing the parallel channel on the daily chart about the zigzag of wave Y blue. Draw the first trend line from the start of Y blue to the low labeled b pink, then place a parallel copy on the high of a pink. Only when this channel is breached by a full daily candlestick below it shall we have confirmation of a big trend change, and until that time we should expect upwards movement to continue.
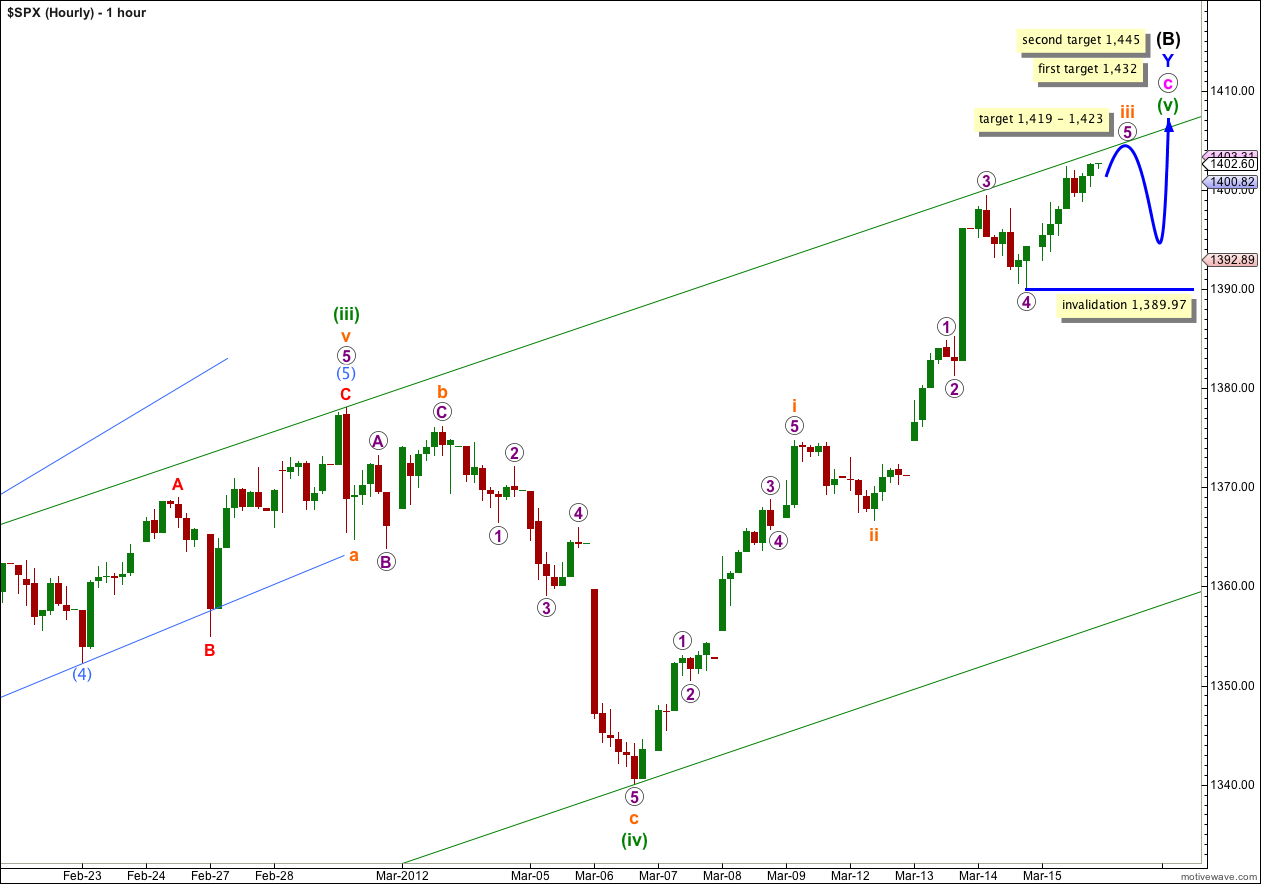
Upwards movement to a new high is in an impulsive structure when viewed on the 5 minute chart. Wave 4 purple is over and wave 5 purple is unfolding. The short term target at 1,401 has been passed and the structure within wave 5 purple is incomplete. A new target must be calculated.
At 1,419 wave 5 purple would reach 1.618 the length of wave 3 purple. At 1,423 wave iii orange would reach 1.618 the length of wave i orange. This gives us a 4 point target zone for this upwards wave to end.
When wave iii orange is complete we should look out for a more time consuming sideways and lower movement for wave iv orange. At that stage we must move the invalidation point down to the high of wave i orange at 1,374.76.
At this stage while wave 5 purple is incomplete no second wave correction within it may move beyond the start of its first wave. This wave count is invalidated with movement below 1,389.97.
If this wave count is invalidated with downwards movement then we should expect that my analysis on the 5 minute chart of wave 5 purple is wrong, that wave 5 purple is over, and that downwards movement would be wave iv orange.
Keep drawing the parallel channel about wave c pink on the hourly chart. Draw the first trend line from the lows of (ii) green (look for this on the daily chart) to (iv) green, then place a parallel copy on the high of (iii) green. We may expect upwards movement to follow along the upper trend line to complete wave iii orange.
When wave iii orange is complete we may use Elliott’s technique to draw a smaller channel about wave (v) green.
Alternate Daily Wave Count.
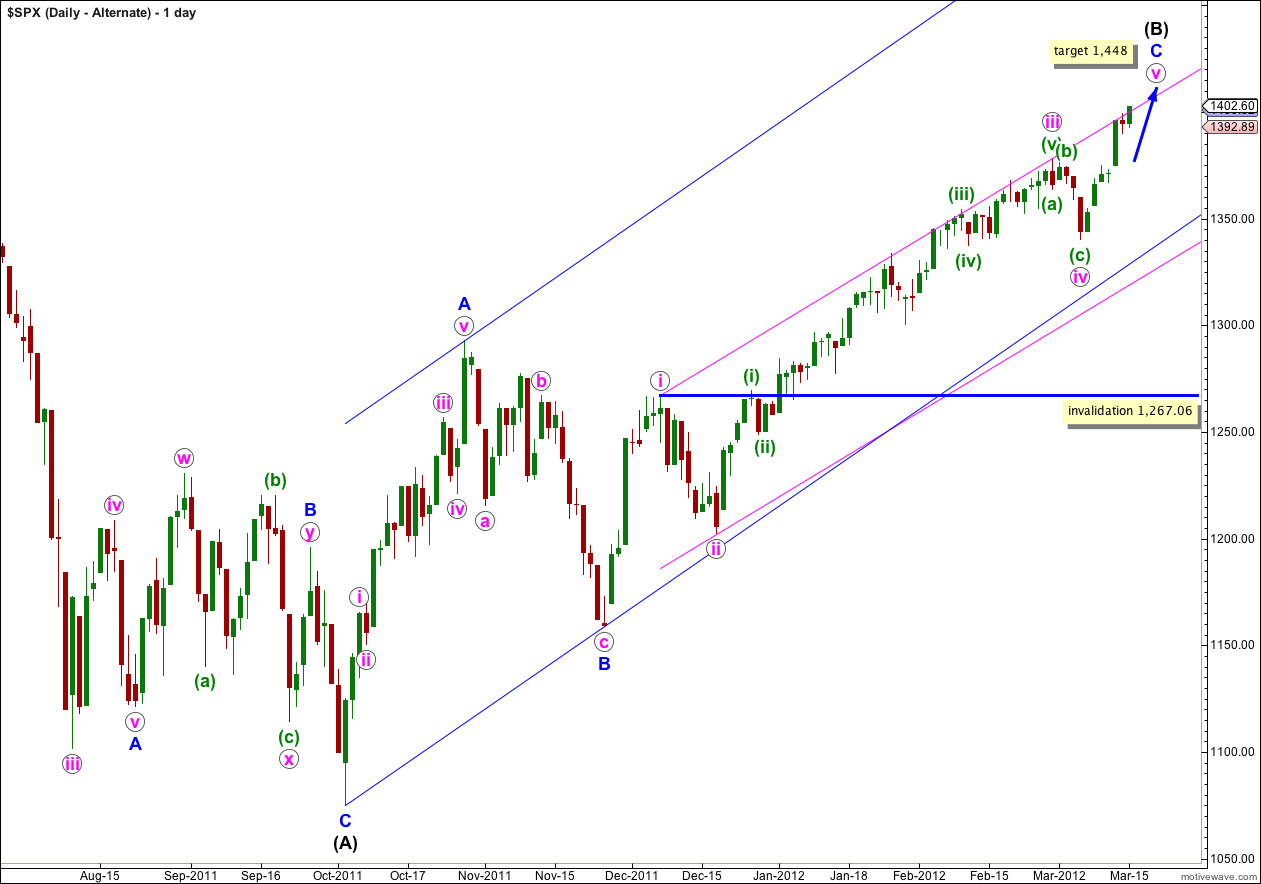
This alternate wave count also sees downwards movement from last week as a fourth wave correction.
Within this wave count wave iii pink is just 0.28 points longer than 1.618 the length of wave i pink. Wave i pink is 108.4 points in length and wave iii pink is 175.67 points in length, and this difference of 0.28 points is extremely small. It is almost a perfect Fibonacci ratio. This adds slight weight to this wave count, or at least to this portion of it.
However, this alternate wave count still has a lower probability than the main wave count because the subdivision of wave A blue upwards is not as satisfactory. But at this stage it makes little difference, because they both expect upwards movement to complete a final fifth wave.
At 1,448 wave v pink would reach equality with wave i pink.
There will probably be no Fibonacci ratio between waves A and C blue within (B) black.
If wave iv pink extends any lower or further sideways as a double flat or double combination, then it may not move into wave i pink price territory. This wave count is invalidated with movement below 1,267.06.
*now
Hey Lara,
I see what they are talking about know … take a look at TLT they say once Wave-c and Wave-4 both terminate simultaneously, it would coincide with a massive correction in the SPX.
LTL Higher low (bounce off trend line)
NYMO Lower high
This should be a fun OPEX… my brothers (bankers) are looking for 23% to 38% retracement 1351 – 1313 in some type of Wave-4
So I will be keeping a close eye on your key line 1,389.97.