
Sideways and slightly lower movement for Monday’s session was mostly what we had expected from last analysis.
We still have two wave counts and no confirmation yet of a possible trend change. We may use confirmation / invalidation points to work with these two counts.
I have removed the prior hourly alternate I was using as it just does not have the right look. I have introduced a new alternate which differs only from the main in structure: a first wave may unfold as either an impulse or a leading diagonal. We should consider both possibilities, but both wave counts expect the same direction of movement next.
Click on the charts below to enlarge.
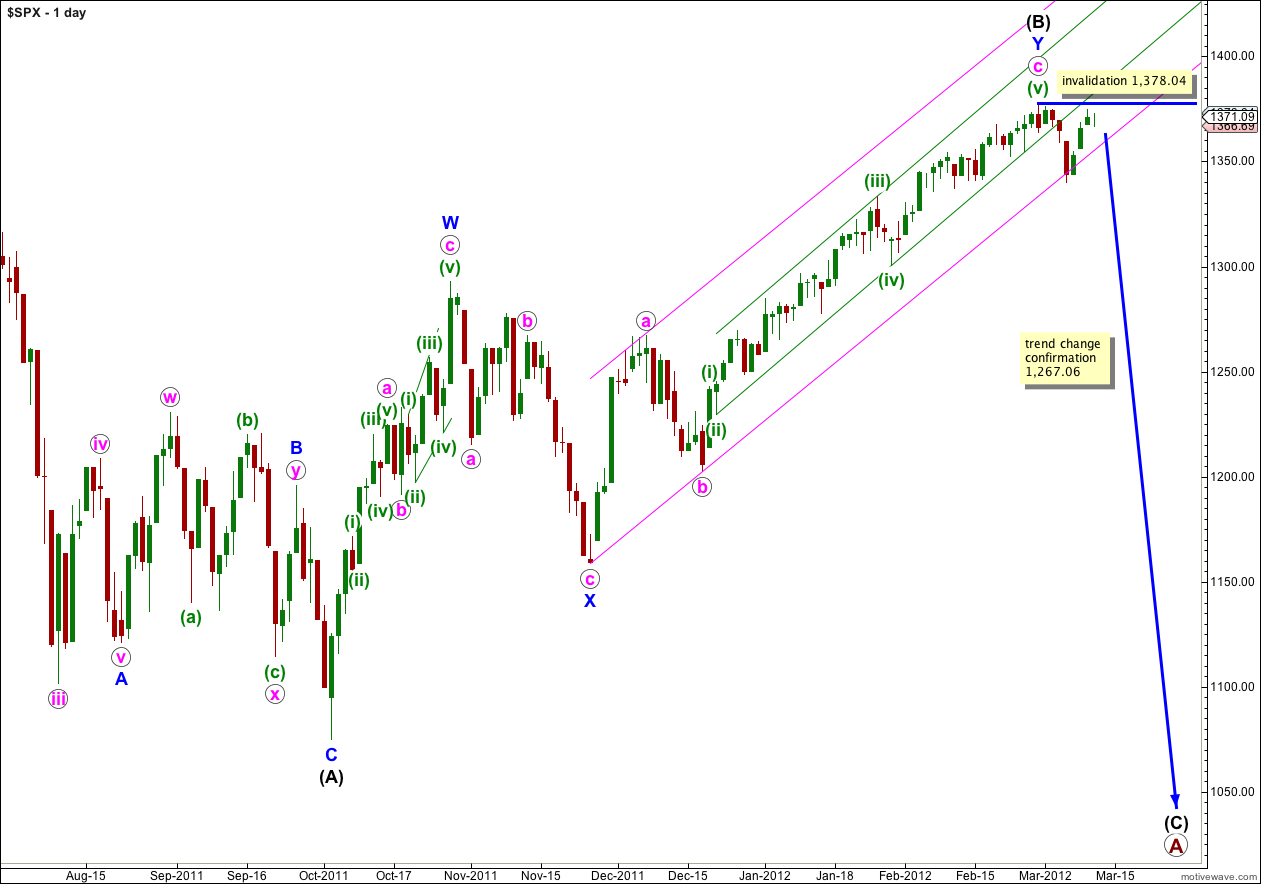
While price does not move above 1,378.04 this wave count will remain valid. If wave (B) black is over and wave (C) black has begun then we should see movement below this parallel channel this week.
Double zigzag structures (as wave (B) black is labeled) are reasonably common. The only corrective structure which begins with two zigzags is a rare triple zigzag. The rarity of triples means that when the second zigzag is over the probability that the entire correction is over is very high indeed. The next wave is most likely to be wave (C) black downwards.
At primary degree wave A is unfolding as a flat correction. With wave (B) black now 108% the length of wave (A) black primary wave A could be either an expanded or running flat. Expanded flats are very common and running flats reasonably rare. The probability that wave (C) black will move below the end of wave (A) black as for an expanded flat correction is extremely high.
Within wave (C) black no second wave correction may move beyond the start of the first wave. This wave count is invalidated with movement above 1,378.04.
Movement below 1,267.06 would invalidate the alternate daily wave count and provide us with full and final confirmation that the S&P 500 has had a major trend change which is likely to see new lows.
Main Hourly Wave Count.
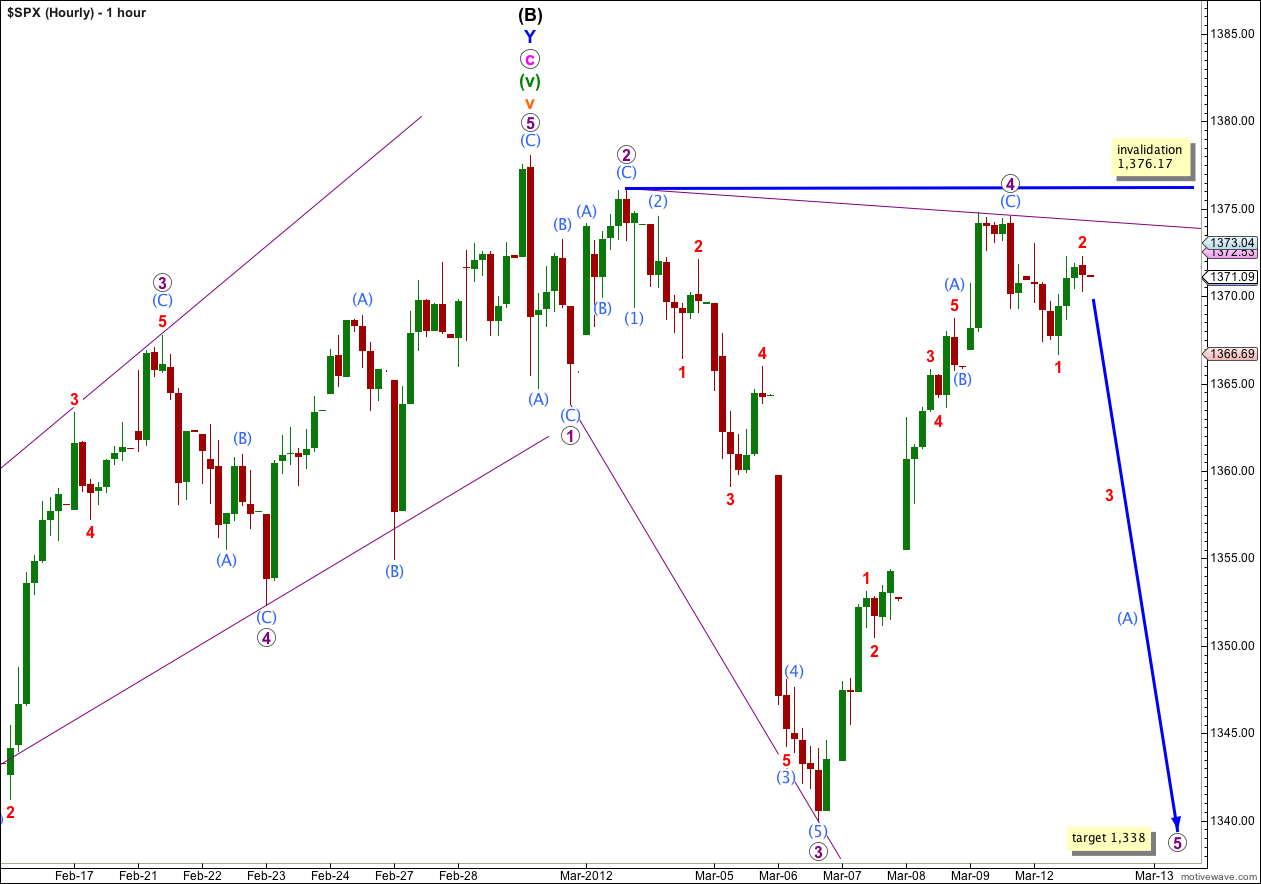
This main wave count sees a leading diagonal unfolding in a first wave position. At this stage this wave count remains valid. However, I had expected wave 4 purple to be a more obvious zigzag and not such a deep correction.
This main hourly wave count has a higher probability than the alternate below mostly because subdivisions on the 5 minute chart are a much better fit.
A leading diagonal may not have a truncated fifth wave. This wave count requires a new low below 1,340.03 to remain valid.
Wave 5 purple is most likely to unfold as a zigzag, but it may also be an impulse.
The diagonal is expanding and wave 5 purple should be longer than wave 3 purple. Equality is achieved at 1,338 and wave 5 purple may end at or just below this target.
Any further extension of wave 4 purple may not move beyond the end of wave 2 purple. This wave count is invalidated with movement above 1,376.17.
Alternate Hourly Wave Count.
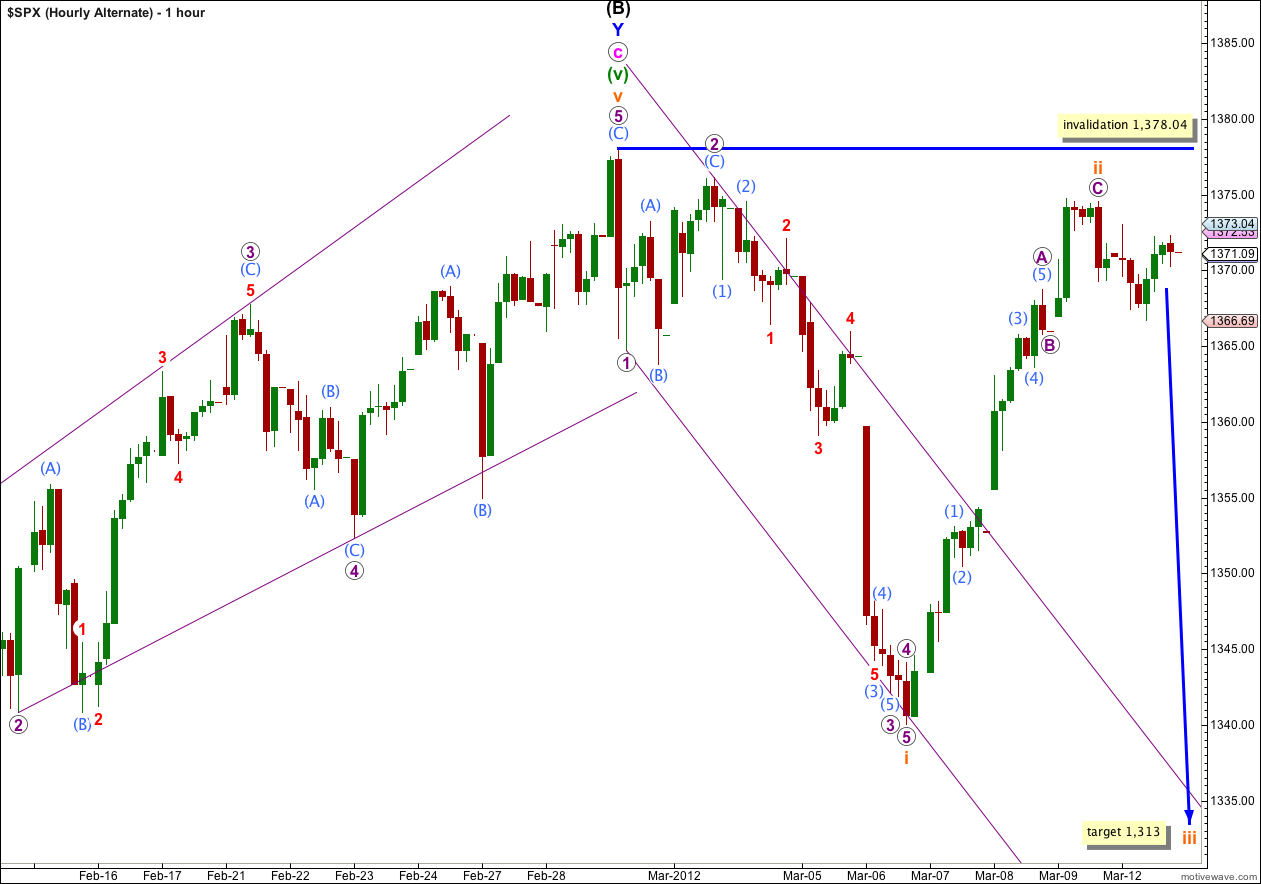
The other possible structure for a first wave is an impulse. It is possible that wave i orange is complete and wave ii orange may also be complete, or nearly so.
This wave count does not fit quite as neatly on the 5 minute chart, and the downwards wave labeled here i orange looks more like a three than a five on the hourly chart. For these reasons this wave count has a lower probability.
However, if this wave count is correct then we should see an increase in downwards momentum as a third wave develops. At 1,313 wave iii orange would reach 1.618 the length of wave i orange.
Any further extension of wave ii orange may not move beyond the start of wave i orange. This wave count is invalidated with movement above 1,378.04.
Alternate Daily Wave Count.
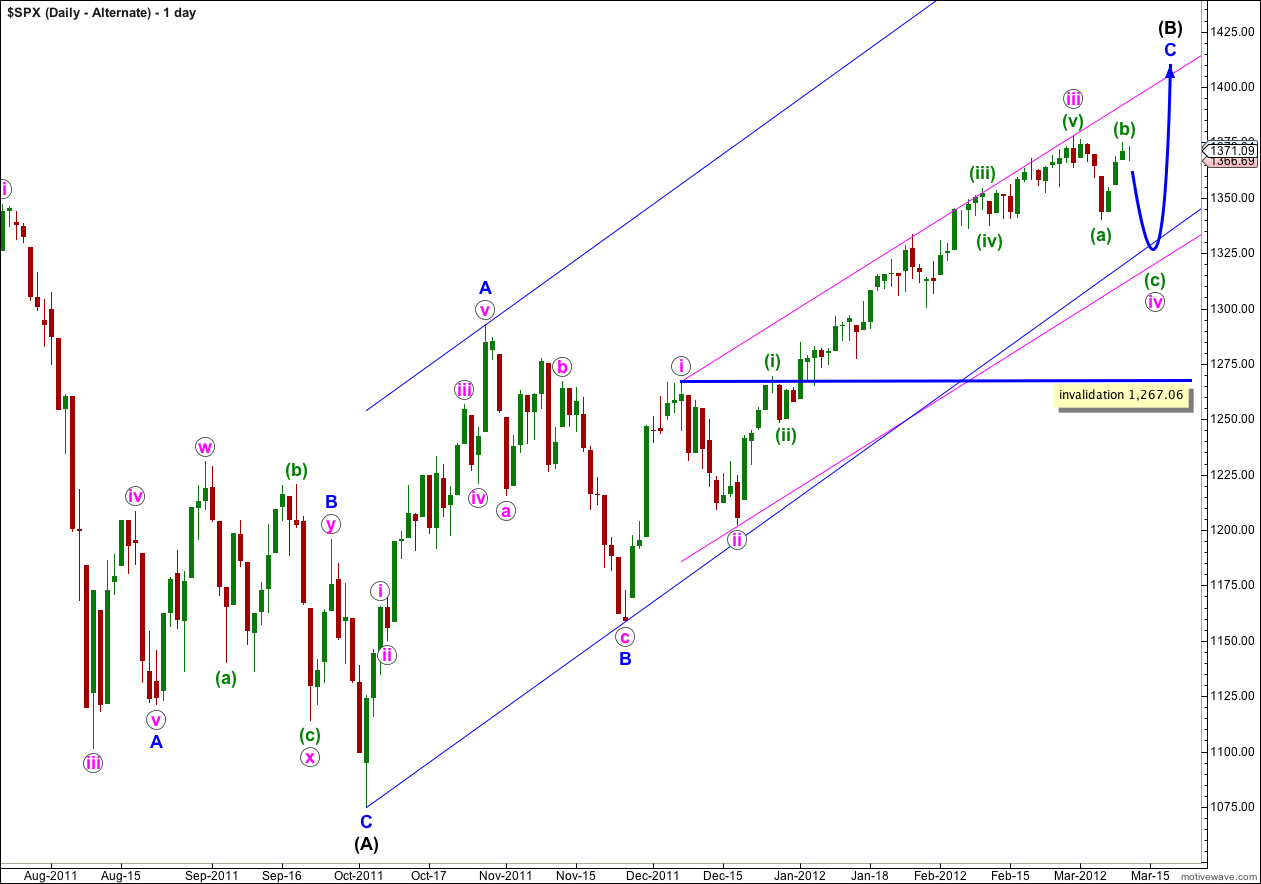
If the main daily wave count is invalidated with upwards movement then this is the alternate I would use.
This alternate looks at the possibility that wave (B) black is an incomplete single zigzag correction. Wave iv pink within wave C blue would be unfolding as a flat correction.
A flat correction may have a B wave which moves beyond the start of it’s A wave. If a new high above 1,378.04 is made then I would expect wave (b) green has moved higher. This should be followed by wave (c) green downwards to end about the lower blue trend line.
This wave count has a lower probability than the main daily wave count because the upwards wave labeled A blue has a much better fit as a three than here as a five.
Wave iv pink may not move into wave i pink price territory. This wave count is invalidated with movement below 1,267.06.
There is no upside limit for B of an expanded flat, but the maximum common length is 138%. Over that the probability reduces. Upwards movement is too strong to be a B wave at this stage I think. It looks more likely that iv pink was briefer and this is v pink.
Lara,
I was also wondering whether the recent downwards movement may have benn pink iv in its entirety. I know it was very brief, but upwards movement now seems to be gathering momentum.
Peter
Lara,
Now that we look to be working on pink (iv), is there any upside limit for wave b of the expanded flat. I assume at some point if this upwards movement continues or accelerates, we will have to consider a different count.
Thanks,
Peter