
Movement above 1,364.72 was unexpected and invalidated our main hourly wave count. The high of 1,378.04 remains intact and our main daily wave count remains valid.
I have gone back over the 5 minute chart for recent movement and I have adjusted the hourly wave count as a result. I had expected we were seeing an impulse unfold downwards, but a leading diagonal fits better on the 5 minute chart.
Click on the charts below to enlarge.
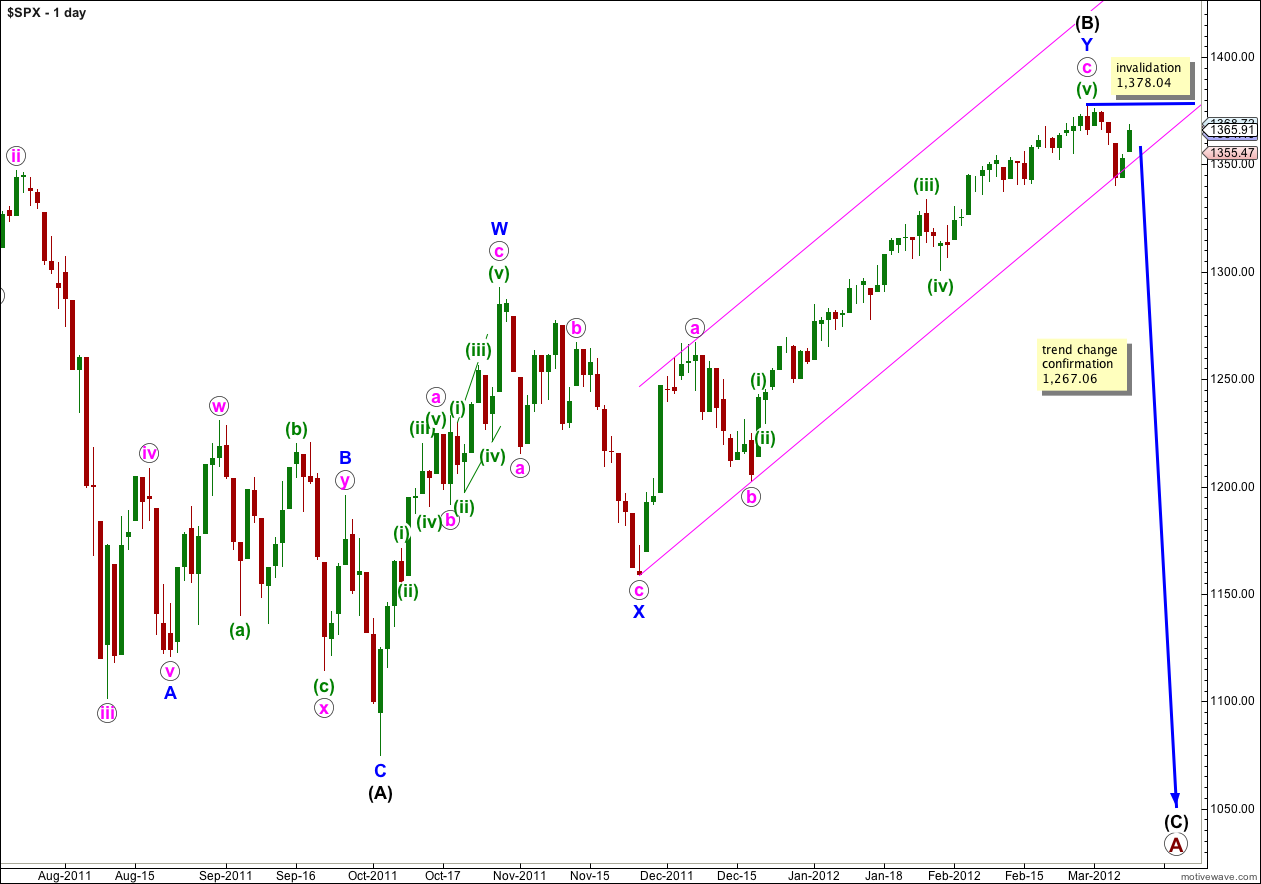
The lower edge of this parallel channel was about where a small correction was initiated. The next wave down should have the momentum to break through this channel. When we have a full daily candlestick below this channel we shall have confirmation that the zigzag labeled wave Y blue is complete.
Double zigzag structures (as wave (B) black is labeled) are reasonably common. The only corrective structure which begins with two zigzags is a rare triple zigzag. The rarity of triples means that when the second zigzag is over the probability that the entire correction is over is very high indeed. The next wave is most likely to be wave (C) black downwards.
At primary degree wave A is unfolding as a flat correction. With wave (B) black now 108% the length of wave (A) black primary wave A could be either an expanded or running flat. Expanded flats are very common and running flats reasonably rare. The probability that wave (C) black will move below the end of wave (A) black as for an expanded flat correction is extremely high.
Within wave (C) black no second wave correction may move beyond the start of the first wave. This wave count is invalidated with movement above 1,378.04.
Movement below 1,267.06 would invalidate the alternate daily wave count and provide us with full and final confirmation that the S&P 500 has had a major trend change which is likely to see new lows.
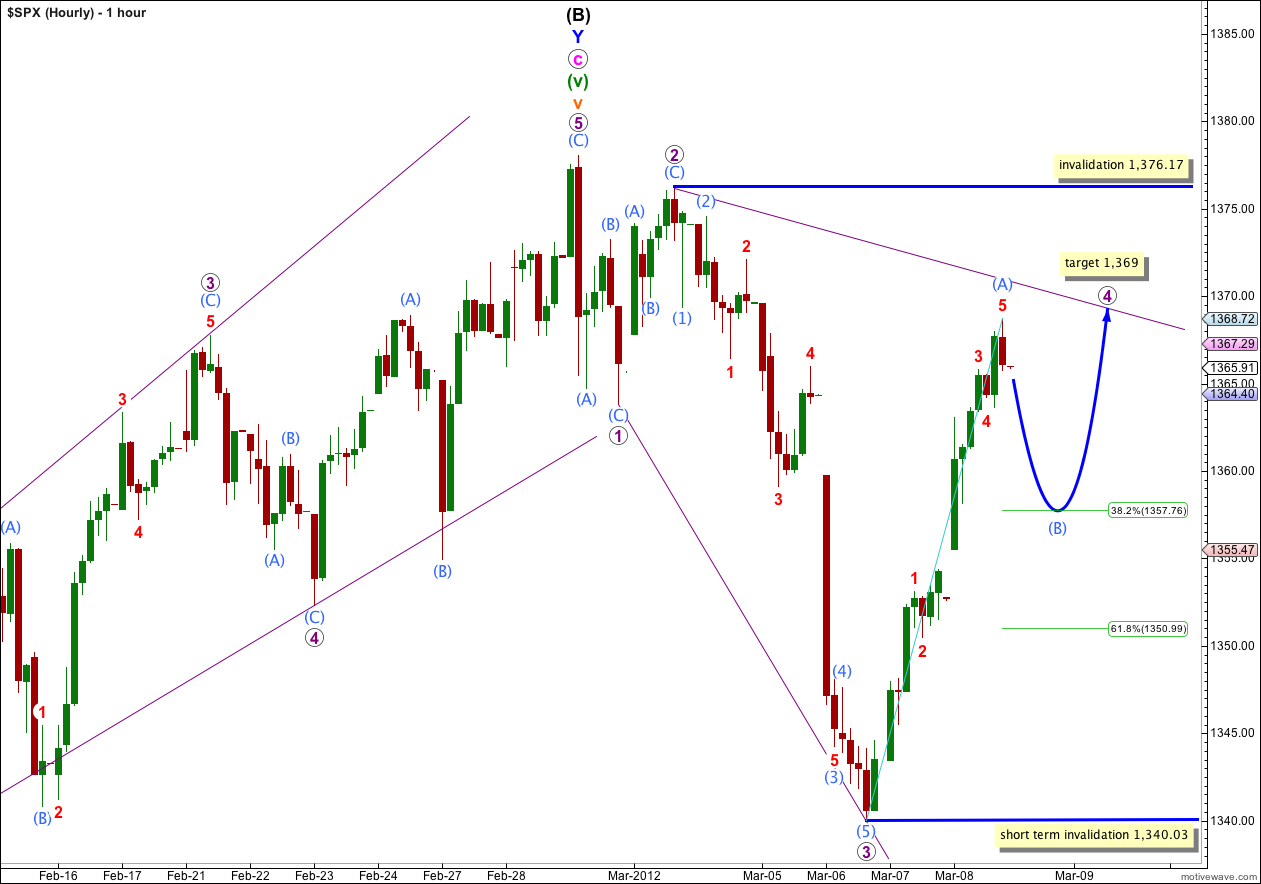
Movement above 1,363.81 invalidated yesterday’s hourly wave count. Upwards movement cannot be a fourth wave within an impulse.
It is possible that a leading diagonal is unfolding in a first wave position. I have gone back to the 5 minute chart for the movement of wave (C) aqua within 1 purple and wave 2 purple, to see if this fits. It actually has a slightly better fit than previous analysis. It also fits better at the end of wave 3 purple on the 5 minute chart.
If a leading diagonal is unfolding then we should expect waves 2 and 4 purple to correct to between 0.66 and 0.81 of waves 1 and 3 purple respectively. Wave 2 purple is deeper, it 0.87 of wave 1 purple. At 1,369 wave 4 purple would reach 0.81 of wave 3 purple, and this is our target for it to end.
Within a leading diagonal subwaves 2 and 4 must be zigzags, subwaves 1, 3 and 5 are normally zigzags but may also be impulses. If one of them is going to be an impulse it is usually the third wave.
Within wave 1 purple zigzag there is no Fibonacci ratio between waves (A) and (C) aqua.
Within wave 2 purple zigzag wave (C) aqua is just 0.15 points short of 0.618 the length of wave (A) aqua.
Within wave 3 purple impulse wave (3) aqua is 1.83 points longer than 4.236 the length of wave (1) aqua, and wave (5) aqua is 0.36 points longer than 0.236 the length of wave (3) aqua. On the 5 minute chart the end of this third wave has a slightly better fit than the alternate hourly wave count below.
Wave 4 purple should be an obvious zigzag. So far upwards movement has an impulsive wave count and only wave (A) aqua is likely to be over. We should expect some downwards movement for wave (B) aqua which may not move beyond the start of wave (A) aqua at 1,340.03, followed by another five waves up for wave (C) aqua which may end about 1,369.
The diagonal is expanding and when wave 4 purple zigzag is over we may expect wave 5 purple to be at least 36.14 points in length to the downside. It is most likely to also unfold as a zigzag.
Within a diagonal wave 4 should overlap wave 1 price territory. Wave 4 purple may not move beyond the end of wave 2 purple. This wave count is invalidated with movement above 1,376.17.
When a leading diagonal unfolds in a first wave position the following second wave should be very deep and end about 0.786 of the first.
Alternate Hourly Wave Count.
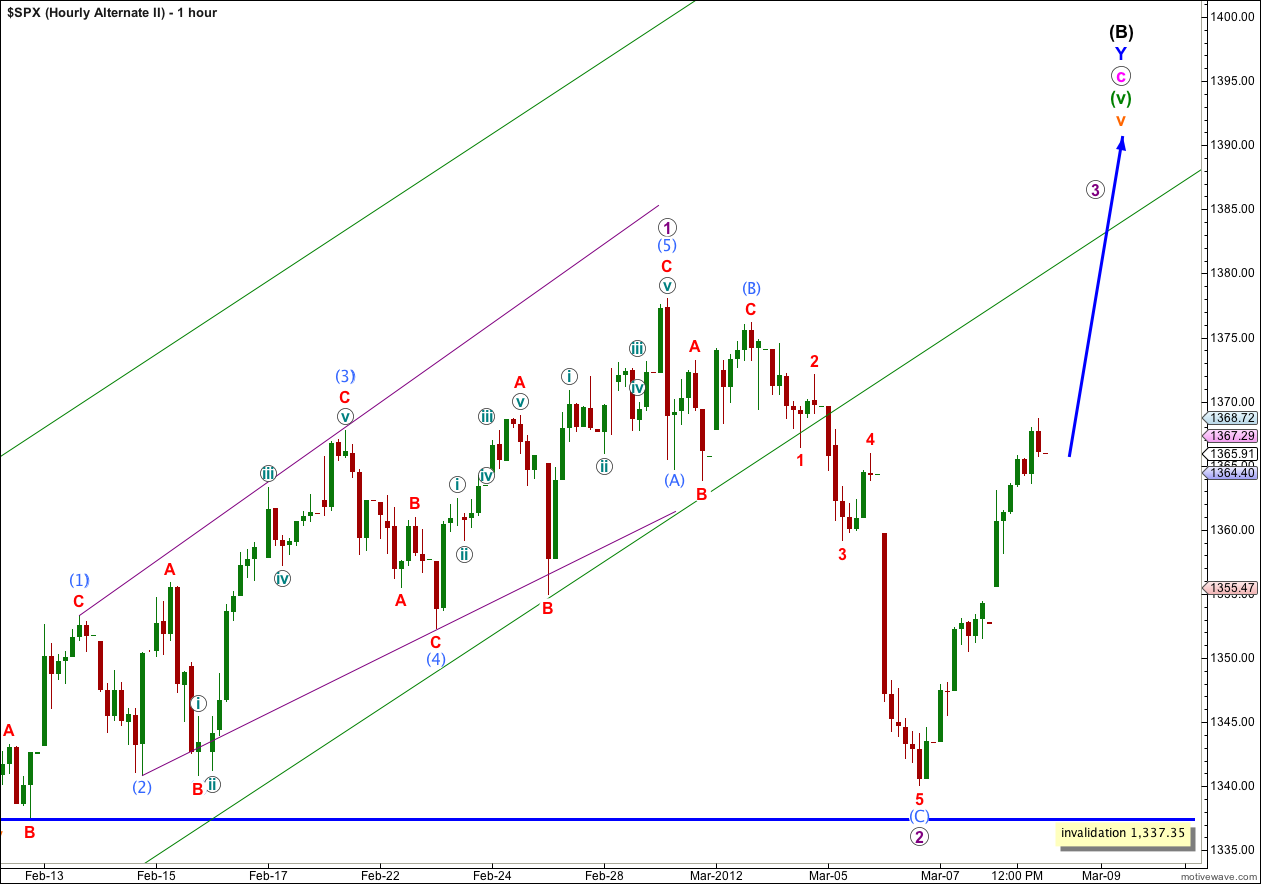
At this stage this alternate wave count still looks very strange and unlikely. However, it is a possibility which we must consider while price is above 1,337.35.
The channel breach here on the hourly chart is extremely obvious. Price remained in this channel since it entered on 20th December last year, until four days ago. This channel breach is significant.
At this stage downwards movement is in a three wave structure and could be corrective. Upwards movement to follow it is so far impulsive.
Alternate Daily Wave Count.
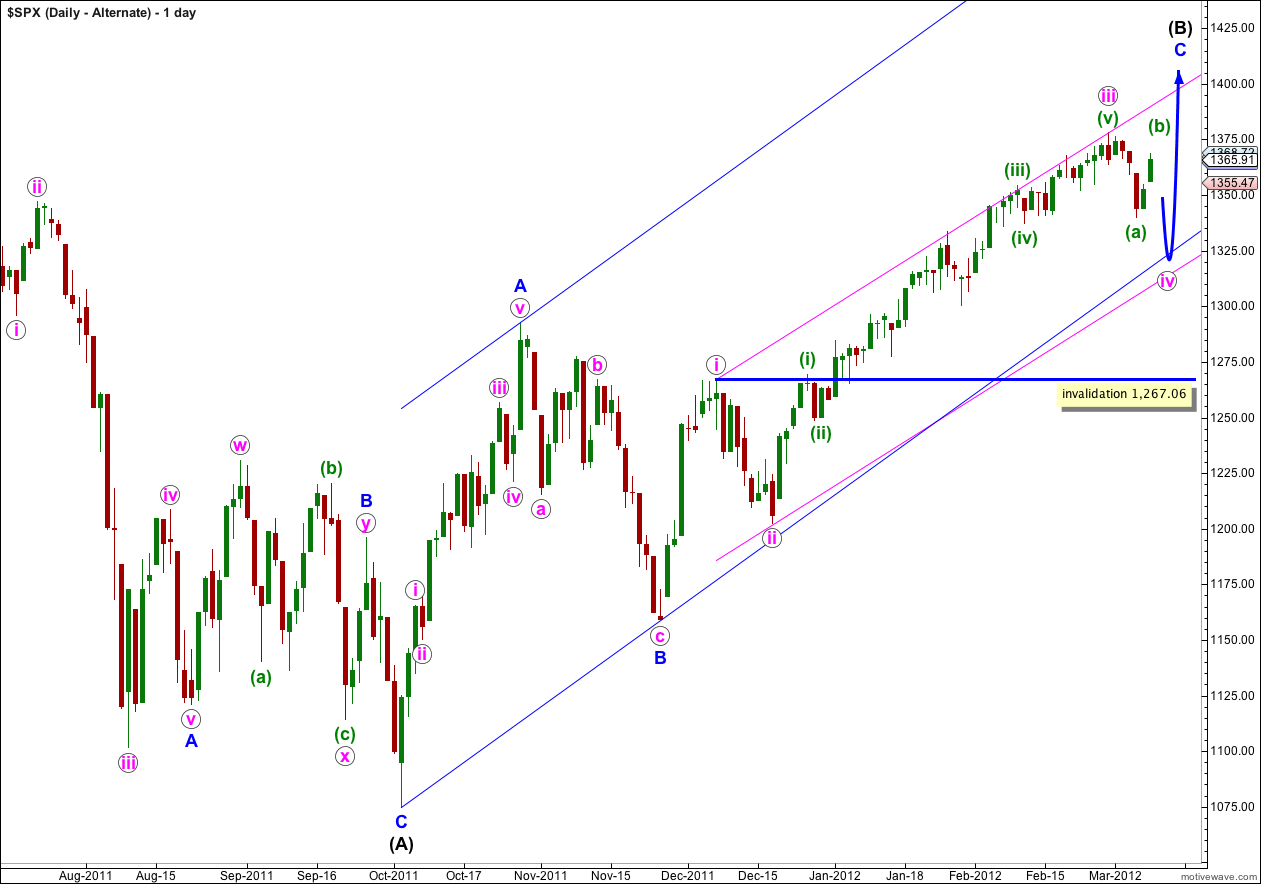
This alternate has a lower probability than the main daily wave count. If this wave count is correct then wave iv pink has begun and is likely to be a flat correction. I would expect it to last one to two weeks and be a relatively shallow correction of wave iii pink. It should look about equal in duration to wave ii pink. It should find support about the lower edge of this pink parallel channel drawn about the possible impulse of wave C blue.
If the upwards wave labeled here A blue was a five, and not a three, then wave (B) black is a single zigzag. Wave C blue is incomplete.
The subdivision of wave A blue as a five is not nearly as satisfactory as seeing it as a three, which the main wave count does. This is the reason why this alternate has a much lower probability.
Wave iv pink may not move into wave i pink price territory and this wave count is invalidated with movement below 1,267.06.
I am really only continuing to consider and publish this chart for you because of the important implication of a breach of 1,267.06. Eventually when we see movement below this point we can be certain that downwards movement is not just a fourth wave correction, and that the upwards trend must be over. At that stage we may have confidence that the S&P is likely to move to a new low below the end of (A) black at 1,074.77.
Yes, I expect that is what it would be. So we would expect a sight new high for wave B, before a sharp downwards wave for wave C.
Lara,
If we are working on pink (iv) can it unfold as an expanded flat?
Peter