
Yesterday’s analysis expected a little upwards movement for a small correction. The short term target was quickly passed and price remains contained with the parallel channel on the hourly chart; the upper edge of this channel was useful in showing us where price would find resistance.
At this stage our main wave count is looking highly likely. Within a few more trading days we may have the confirmation we seek for a big trend change on the S&P 500.
Click on the charts below to enlarge.
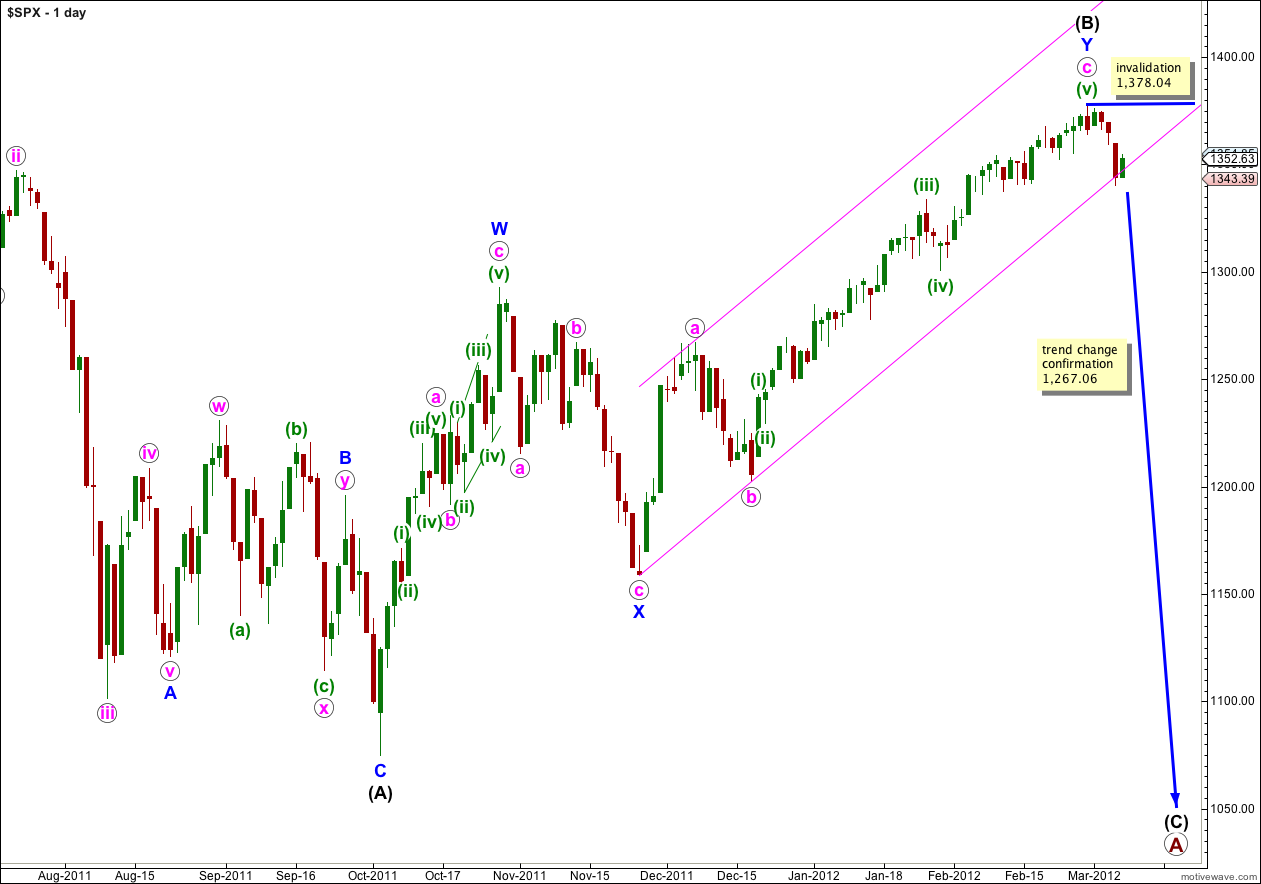
The lower edge of this parallel channel was about where a small correction was initiated. The next wave down should have the momentum to break through this channel. When we have a full daily candlestick below this channel we shall have confirmation that the zigzag labeled wave Y blue is complete.
Double zigzag structures (as wave (B) black is labeled) are reasonably common. The only corrective structure which begins with two zigzags is a rare triple zigzag. The rarity of triples means that when the second zigzag is over the probability that the entire correction is over is very high indeed. The next wave is most likely to be wave (C) black downwards.
At primary degree wave A is unfolding as a flat correction. With wave (B) black now 108% the length of wave (A) black primary wave A could be either an expanded or running flat. Expanded flats are very common, running flats are reasonably rare. The probability that wave (C) black will move below the end of wave (A) black as for an expanded flat correction is extremely high.
Within wave (C) black no second wave correction may move beyond the start of the first wave. This wave count is invalidated with movement above 1,378.04.
Movement below 1,267.06 would invalidate the alternate daily wave count and provide us with full and final confirmation that the S&P 500 has had a major trend change which is likely to see new lows.
Main Hourly Wave Count.
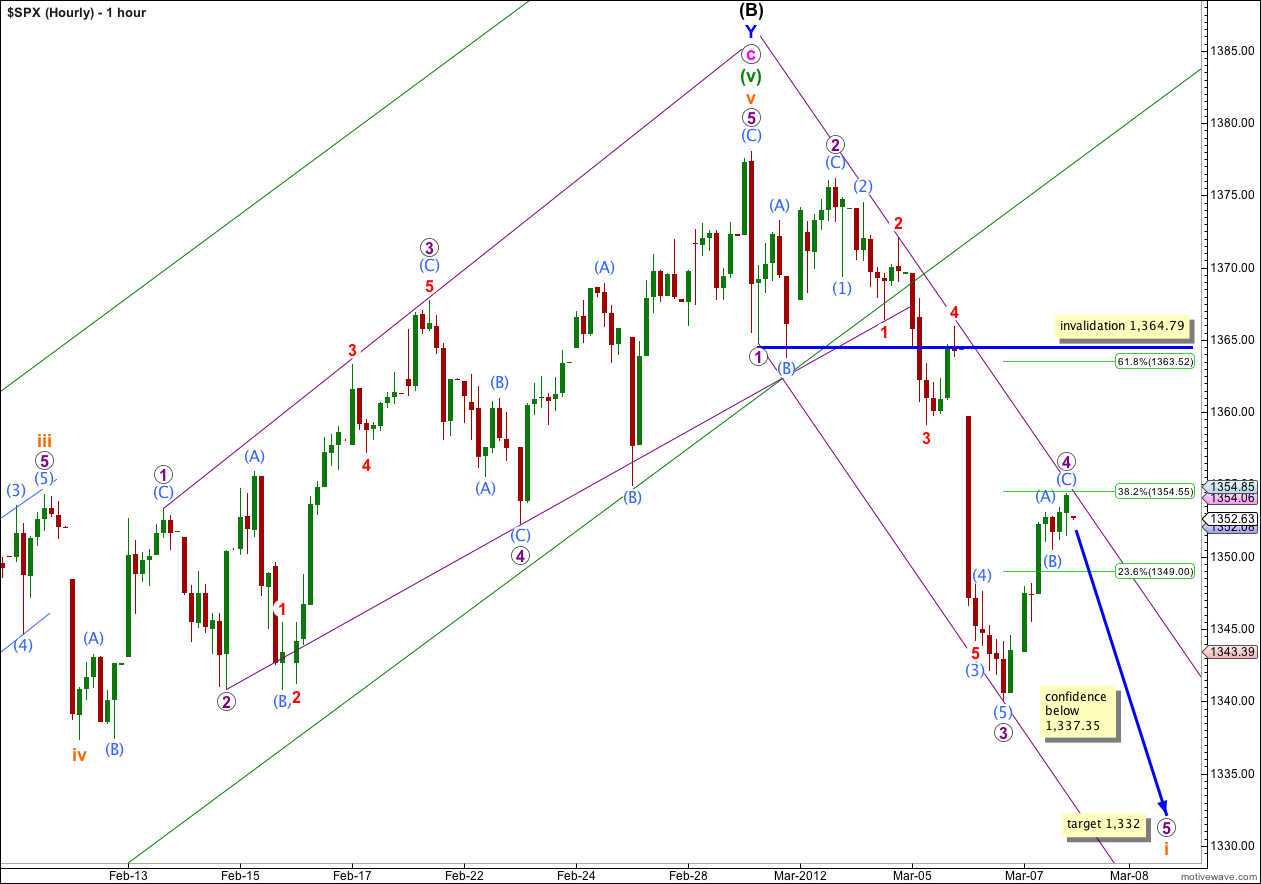
The short term target was about 1,349. This was quickly reached and passed by upwards movement. Wave 4 purple looks like it has ended about the 0.382 Fibonacci ratio of wave 3 purple and has found resistance at the upper edge of the parallel channel drawn about this downwards movement.
Draw this trend channel from the lows of 1 to 3 purple then place a parallel copy on the high of 2 purple. I have moved the parallel copy slightly up a little to sit on the end of wave 2 red within (3) aqua of 3 purple; in this instance it seems this is the correct line of resistance. Expect wave 5 purple to end mid way within this channel.
At 1,332 wave 5 purple would reach 0.618 the length of wave 3 purple. If it were to reach only equality with wave 1 purple it may be truncated (slightly) so this next target seems more likely.
When this last wave downwards ends then we shall have a clear five down on the hourly chart. This would give me a higher level of confidence in this wave count and it would be more likely that we have seen a trend change (for the mid term at least, if not the long term).
On the 5 minute chart wave 4 purple has a corrective wave count, it looks like a zigzag. There is nice alternation between waves 2 and 4 purple: wave 2 purple is a deep expanded flat and wave 4 purple is a shallow zigzag.
Any further upwards movement tomorrow of wave 4 purple may not move into wave 1 purple price territory. This wave count is invalidated with movement above 1,364.79.
If price turns downwards tomorrow as this wave count expects, then as soon as we have a 5 down on the 5 minute chart we need to move the invalidation point to the start of wave 1 purple at 1,378.04. When wave 5 purple completes wave i orange we shall be expecting a second wave correction, ii orange, which could move right up to the start of wave i orange. Wave ii orange should break out of this parallel channel to the upside, when it does that will be confirmation it has begun.
Alternate Hourly Wave Count.
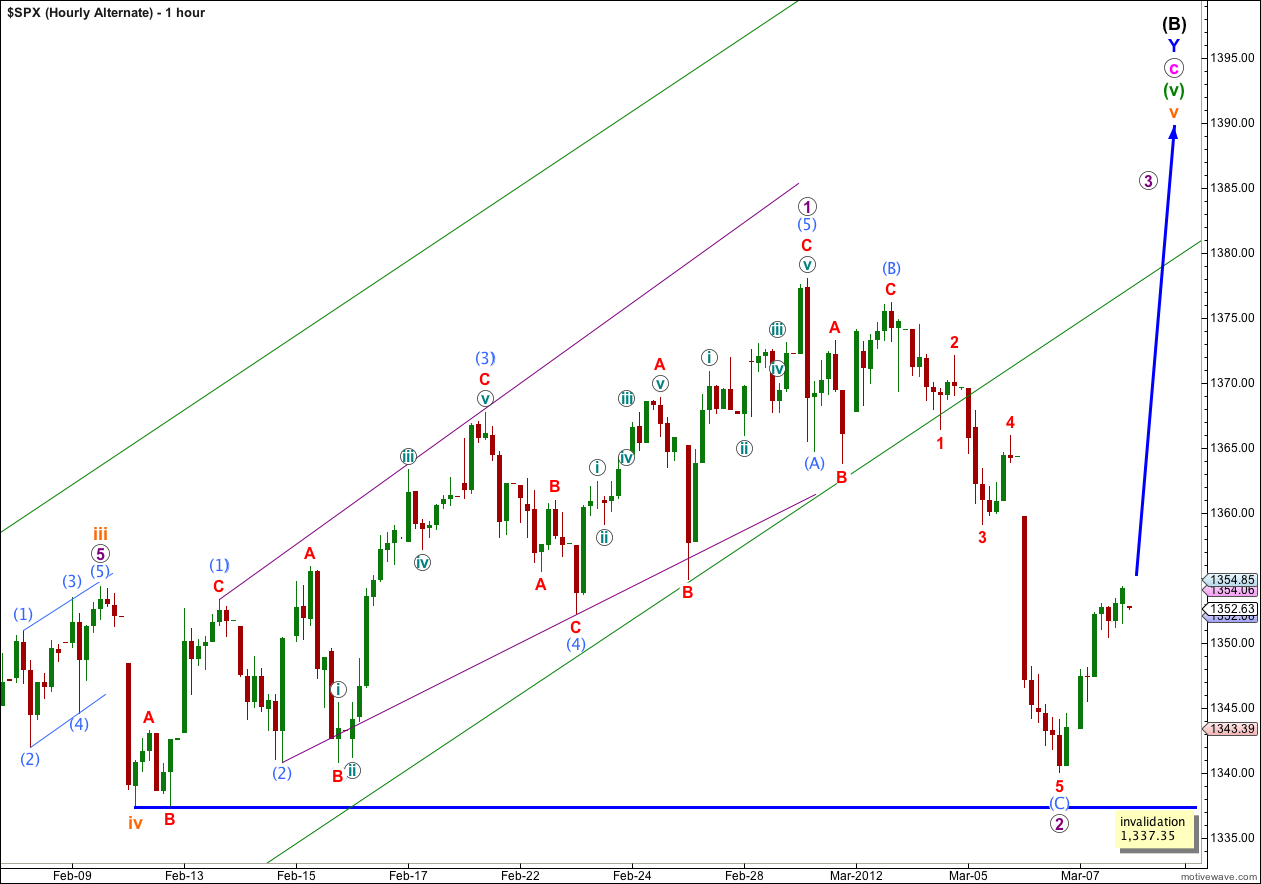
At this stage this alternate wave count looks very strange and unlikely. However, it is a possibility which we must consider while price is above 1,337.35.
The channel breach here on the hourly chart is extremely obvious. Price remained in this channel since it entered on 20th December last year, until three days ago. This channel breach is significant.
At this stage downwards movement is in a three wave structure and could be corrective. I expect that tomorrow this wave count would be invalidated. Wave 2 purple may not move beyond the start of wave 1 purple. This wave count is invalidated with movement below 1,337.35.
Alternate Daily Wave Count.
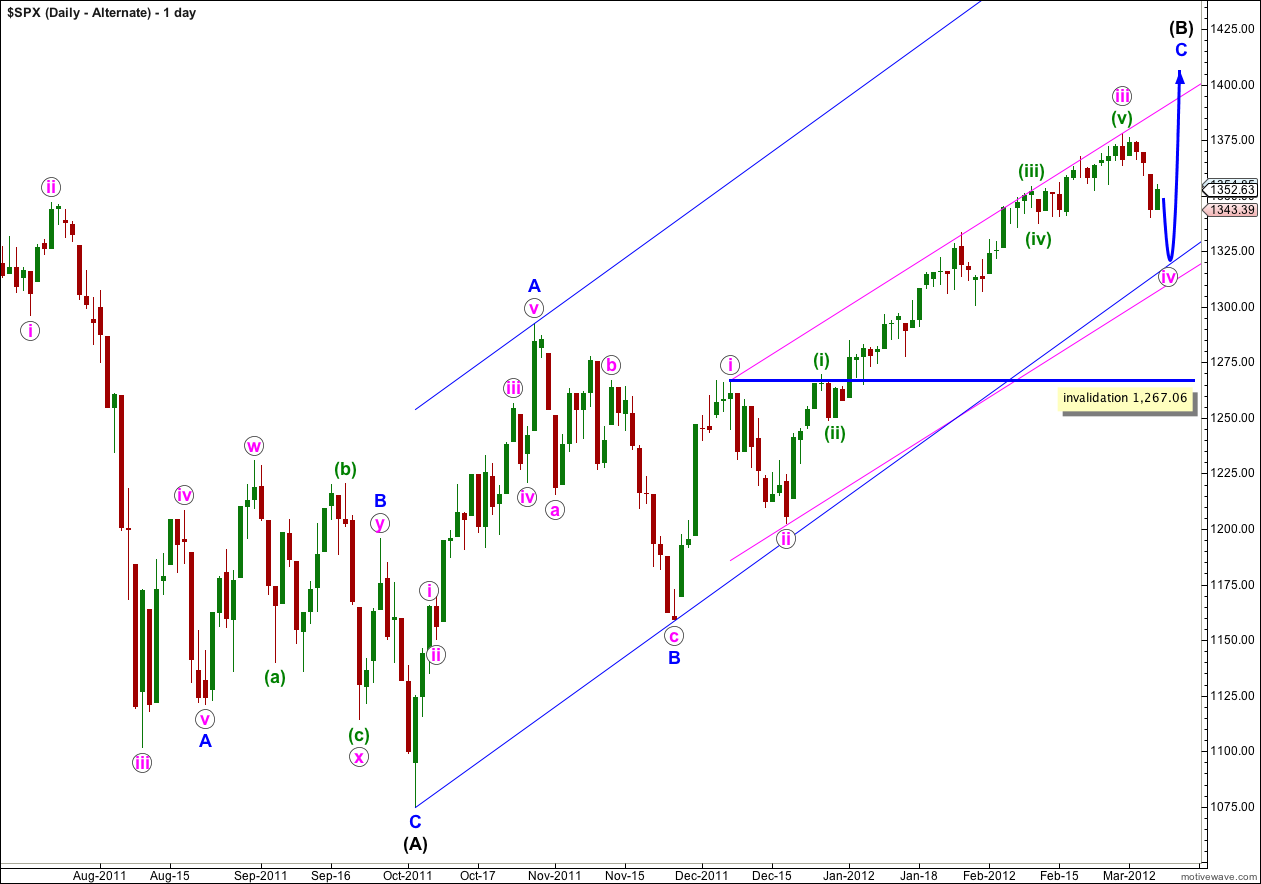
This alternate has a lower probability than the main daily wave count. If this wave count is correct then wave iv pink has just begun. I would expect it to last one to two weeks and be a relatively shallow correction of wave iii pink. It should look about equal in duration to wave ii pink. It should find support about the lower edge of this pink parallel channel drawn about the possible impulse of wave C blue.
If the upwards wave labeled here A blue was a five, and not a three, then wave (B) black is a single zigzag. Wave C blue is incomplete.
The subdivision of wave A blue as a five is not nearly as satisfactory as seeing it as a three, which the main wave count does. This is the reason why this alternate has a much lower probability.
Wave iv pink may not move into wave i pink price territory and this wave count is invalidated with movement below 1,267.06.
I am really only continuing to consider and publish this chart for you because of the important implication of a breach of 1,267.06. Eventually when we see movement below this point we can be certain that downwards movement is not just a fourth wave correction, and that the upwards trend must be over. At that stage we may have confidence that the S&P is likely to move to a new low below the end of (A) black at 1,074.77.
Lara,
Futures are pointing to a higher open. If your main wave count is invalidated, would a leading diagonal for the first wave down be a possibility. Your current alternate, as you acknowledge, just seems to have an awkward look to it.
Thanks,
Peter