
Movement below 1,363.81 and outside the parallel channel we have been using on the hourly chart is a very early indication of a possible trend change.
At this early stage the best approach is to consider all possibilities. We will use alternate wave counts with invalidation and confirmation points to work with these.
Click on the charts below to enlarge.
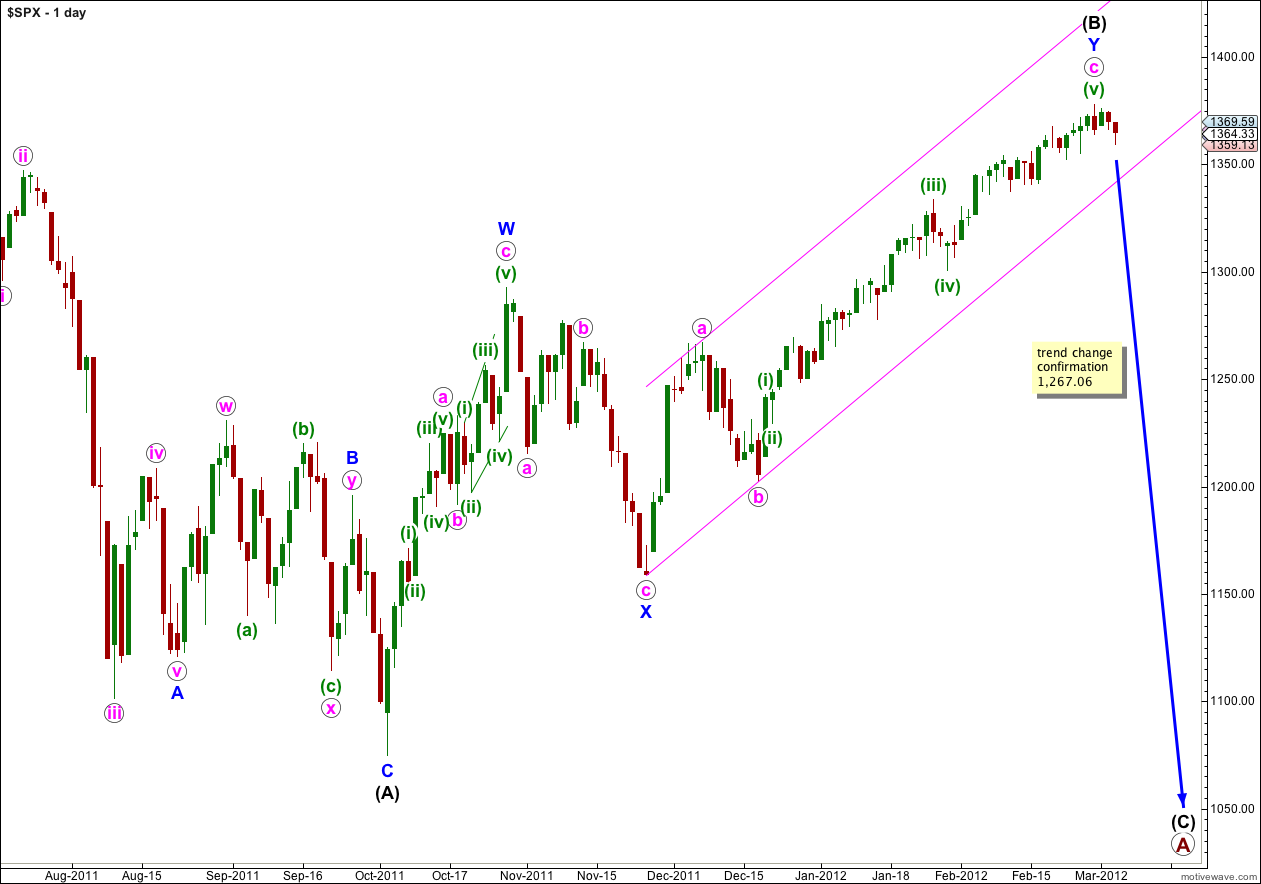
Today my main hourly wave count sees the possibility that wave (B) black is over. Only when we have a breach of the pink parallel channel containing wave Y blue will I calculate a target for wave (C) black downwards as it would be premature to do so today. Until this trend change is confirmed this wave count should be approached with caution given this is the third time since this upwards trend began on 20th December 2011 that my main daily wave count has seen an end to wave c pink. The first two times we did not have confirmation of a trend change (obviously) and we don’t have confirmation this time either.
If wave (B) black is over it is a 108% correction of wave (A) black. This indicates that primary wave A is an expanded flat correction and we would expect wave (C) black to end substantially below the end of wave (A) black.
Wave Y blue is just 1.49 points longer than equality with wave W blue.
Within wave Y blue zigzag wave c pink is just 0.28 points longer than 1.618 the length of wave a pink.
Within wave c pink wave (iii) green is just 1.94 points short of 2.618 the length of wave (i) green, and wave (v) green has no Fibonacci ratio to either of (i) or (iii) green.
Wave (B) black is here labeled as a double zigzag, which is a relatively common structure. The only corrective structure which begins with two zigzags is a rare triple zigzag. The rarity of triples means that when we have confirmation that the second zigzag is complete then the probability that the entire correction is over will be very high indeed.
Movement below 1,267.06 would provide full and final confirmation that this trend change should be very large.
Main Hourly Wave Count.
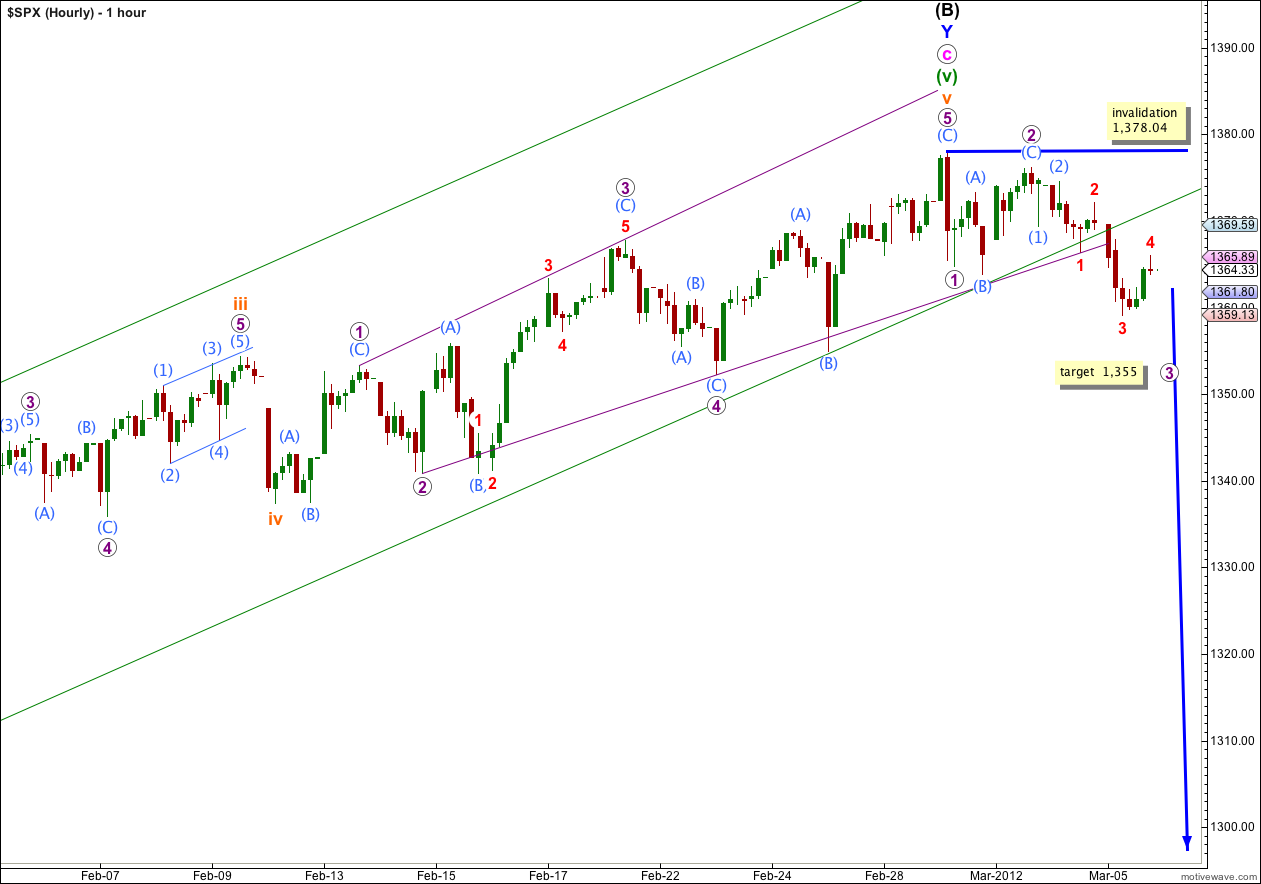
Monday’s downwards movement is a very clear breach of the parallel channel which price has remained in since 20th December, 2011. This may be an early indication that we have seen a trend change.
At 1,355 wave 3 purple would reach 1.618 the length of wave 1 purple.
At this very early stage I will leave the invalidation point at the high of 1,378.04. Any movement to a new high would clearly invalidate this wave count.
When we can see a clear five down on the hourly chart then we may have a little more confidence in this wave count. This may come after another couple of trading sessions.
When wave 3 purple is complete we may move the invalidation point down to the end of wave 1 purple at 1,364.72. Wave 4 purple may not move into wave 1 purple price territory.
If wave (B) black is over then within wave (v) green there are no Fibonacci ratios between waves i, iii and v orange.
Alternate Hourly Wave Count.
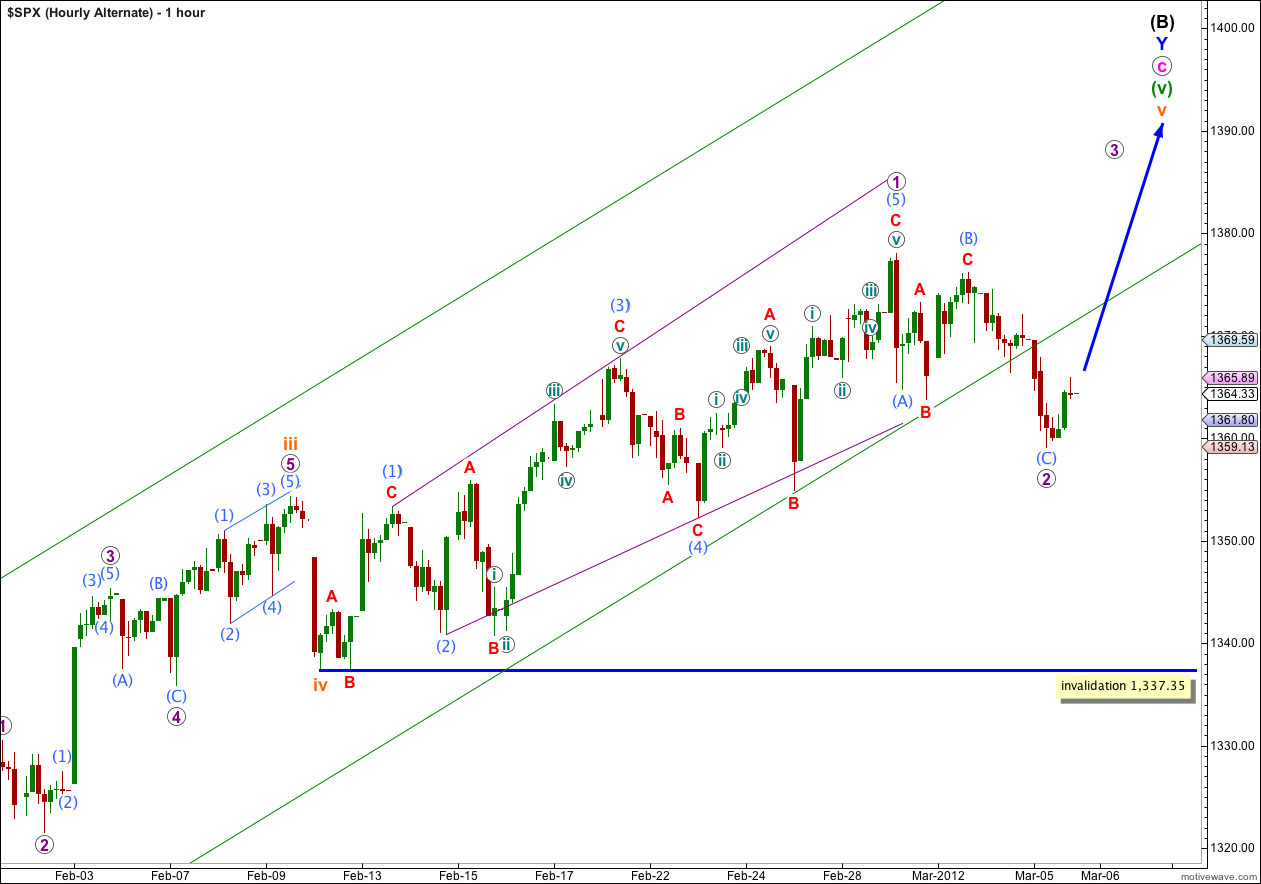
By simply moving the degree of labeling for the diagonal down one degree it may be only wave 1 purple within wave v orange.
This wave count looks unlikely with the clear trend channel breach though. I am considering it only to consider all possibilities, however unlikely.
Wave 2 purple may not move beyond the start of wave 1 purple. This wave count is invalidated with movement below 1,337.35.
Alternate Daily Wave Count.
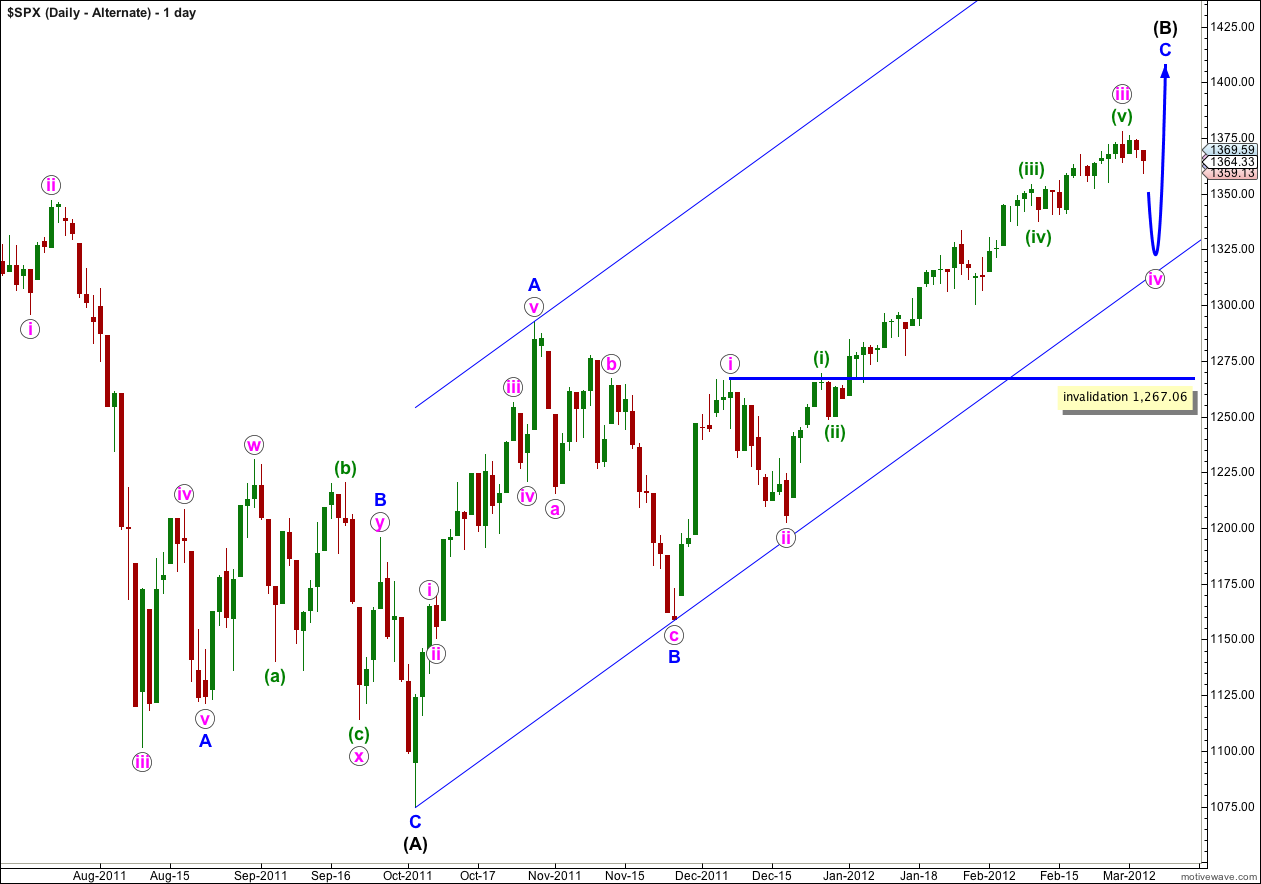
This alternate has a lower probability than the main daily wave count. If this wave count is correct then wave iv pink has just begun. I would expect it to last one to two weeks and be a relatively shallow correction of wave iii pink. It should look about equal in duration to wave ii pink.
If the upwards wave labeled here A blue was a five, and not a three, then wave (B) black is a single zigzag. Wave C blue is incomplete.
The subdivision of wave A blue as a five is not nearly as satisfactory as seeing it as a three, which the main wave count does. This is the reason why this alternate has a much lower probability.
Wave iv pink may not move into wave i pink price territory and this wave count is invalidated with movement below 1,267.06.
I am really only continuing to consider and publish this chart for you because of the important implication of a breach of 1,267.06. Eventually when we see movement below this point we can be certain that downwards movement is not just a fourth wave correction, and that the upwards trend must be over. At that stage we may have confidence that the S&P is likely to move to a new low below the end of (A) black at 1,074.77.
NYMO has support (trend line) at -70 area
http://stockcharts.com/h-sc/ui?s=$NYMO&p=D&yr=0&mn=9&dy=0&id=p36023403465