
As expected the S&P 500 moved higher, although it has not made a new high and both of our hourly wave counts remain valid. The main hourly wave count looks even more likely today. With more structure to analyse I am now able to calculate a target. We should expect this target to be met within another one or two trading sessions, if this wave count is correct.
Click on the charts below to enlarge.
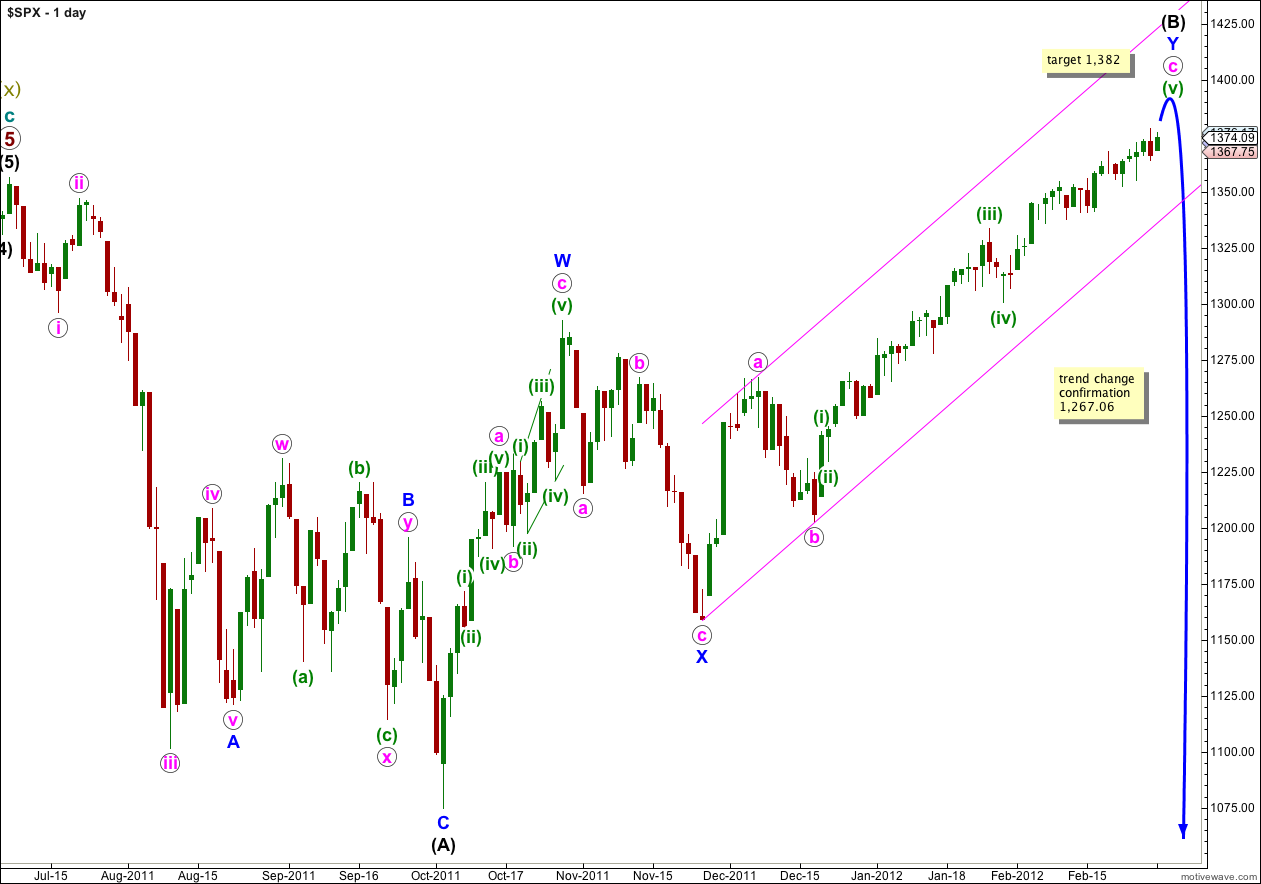
This main wave count follows on from our main historic monthly chart. It sees a flat correction at primary degree unfolding, and wave (B) black within that flat correction is probably within its last upwards wave and may end within the next day or two.
Waves a and b pink within wave Y blue lasted a Fibonacci 8 days. Wave c pink is much longer, so far at 49 days. The next number in the Fibonacci sequence is 55, and wave c pink could possibly end on the 9th of March, 2012 (give or take one day either side of this date). Please be aware this is a rough guideline only. While Fibonacci price ratios are commonly seen, Fibonacci time relationships are less reliable. If the main hourly wave count is correct and upwards movement ends within another one or two trading sessions then wave c pink would have no Fibonacci time relationship.
Wave (B) black is here labeled as a double zigzag, which is a relatively common structure. When the second zigzag labeled wave Y blue is complete the probability that wave (B) black is complete will be very high indeed. The only way wave (B) black could continue further would be as a rare triple zigzag and the rarity of this structure means it has a very low probability.
Wave (B) black may move beyond the start of wave (A) black, and in fact for flat corrections this is most common. The maximum common length of B in relation to A within a flat is 138%. This would be achieved at 1,459. It is likely we shall see a trend change before this price point.
We may use Elliott’s channeling technique to draw a channel about wave Y blue. When this channel is breached by a full daily candlestick below it then we shall have strong confirmation of a trend change.
Wave (C) black is extremely likely to take price below the end of wave (A) black at 1,074.77.
Main Hourly Wave Count.
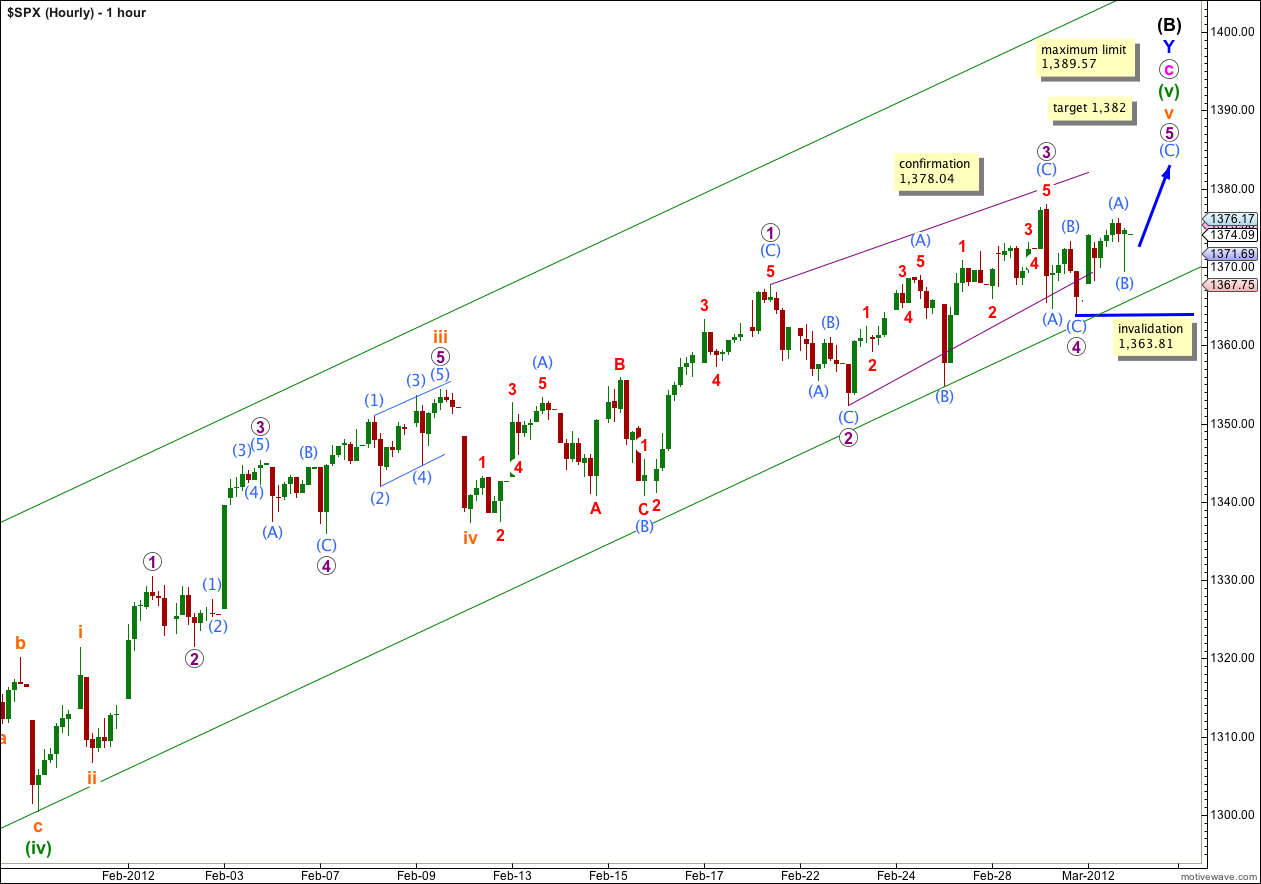
Movement over the last couple of days fits this wave count better than the alternate.
Wave 5 purple must unfold as a zigzag. It does not need to make a new high above the end of wave 3 purple, but it is most likely that it would. Within wave 5 purple wave (A) aqua is a perfect five wave impulse on the five minute chart. Wave (B) aqua is a complete zigzag on the five minute chart.
At 1,382 wave (C) aqua would reach equality with wave (A) aqua. This is our target for upwards movement to end in another one or two trading sessions.
Within wave 5 purple any further downwards movement of wave (B) aqua may not move beyond the start of wave (A) aqua. This wave count is invalidated with movement below 1,363.81.
When this diagonal structure is complete we will be faced with the possibility that it could be only wave 1 purple within wave v orange, if we move everything from the low labeled iv orange down one degree. It looks very unlikely as the proportions don’t look right, but it will have to be a possibility that we shall have to consider. Movement below 1,337.35 would eliminate that possibility.
When we see strong movement below this green parallel channel on the hourly chart this will be early indication that we may have seen a trend change. This channel has not been breached since price moved into it on December 20th. A breach would be very significant.
Alternate Hourly Wave Count.
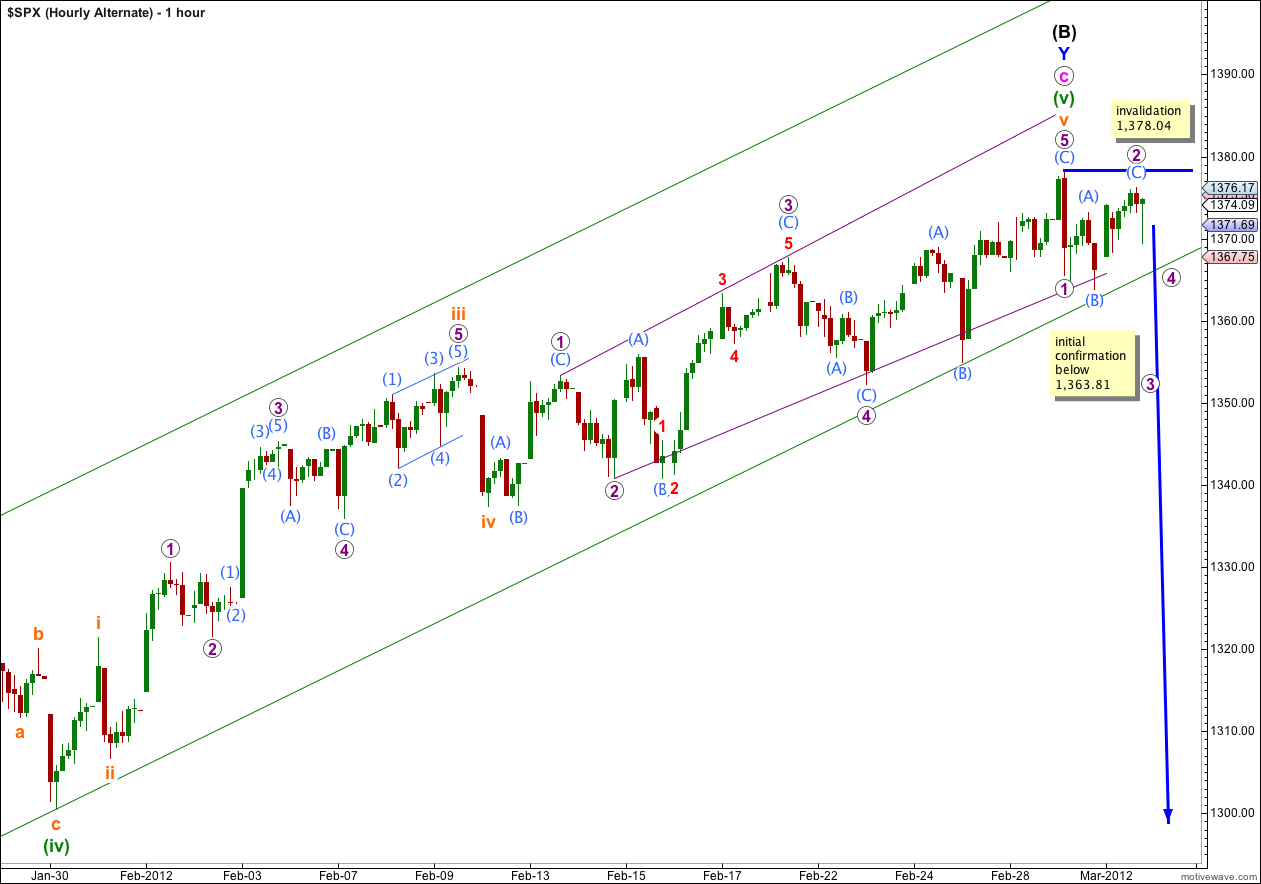
Recent movement can be seen as a small first wave and a following expanded flat correction for a second wave. This is possible, but it does not have as typical a look as the main wave count.
The downwards wave labeled (B) aqua is seen as a five wave structure for the main hourly wave count, here it must be seen as a three. It is ambiguous, but it is more clearly seen as a five on the five minute chart. This reduces the probability of this wave count further.
If the main wave count is invalidated with movement below 1,363.81 then we would have to consider this alternate more likely.
Wave 2 purple may not move beyond the start of wave 1 purple. This wave count is invalidated with movement above 1,378.04.
Alternate Daily Wave Count.
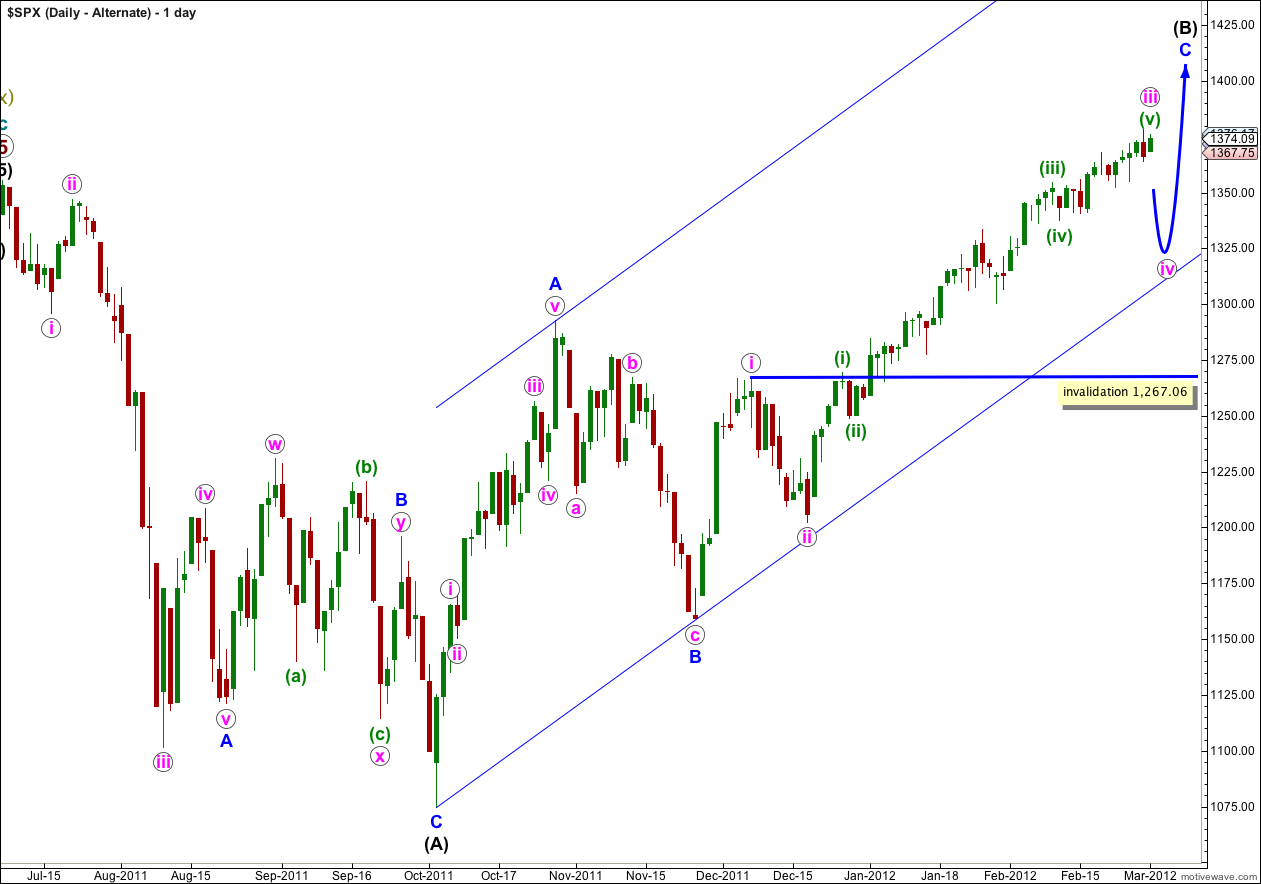
This alternate has a lower probability than the main daily chart. At this stage it is starting to look even more unlikely. If this wave count was correct I would have expected to see reasonable downwards movement for wave iv pink by now.
If the upwards wave labeled here A blue was a five, and not a three, then wave (B) black is a single zigzag. Wave C blue is incomplete.
The subdivision of wave A blue as a five is not nearly as satisfactory as seeing it as a three, which the main wave count does. This is the reason why this alternate has a much lower probability.
It looks increasingly like wave iii pink would be incomplete. When wave iv pink begins we would expect it to last one to two weeks and be a relatively shallow correction of wave iii pink. It should look about equal in duration to wave ii pink.
Wave iv pink may not move into wave i pink price territory and this wave count is invalidated with movement below 1,267.06.
Dollar currently has a 96% open gap which does not look to bullish now, but could be a start of a trend change in a few days. HOD 79.451 ES LOD 1366.25
Which would work well with the main wave count
Lara,
Thank you!
You’re welcome.