
The S&P 500 did move higher which is what we were expecting, but it still lacks momentum and upwards movement is not convincing. Our wave count sees an incomplete structure and we should expect this trend to continue for a while yet, towards our target.
Click on the charts below to enlarge.
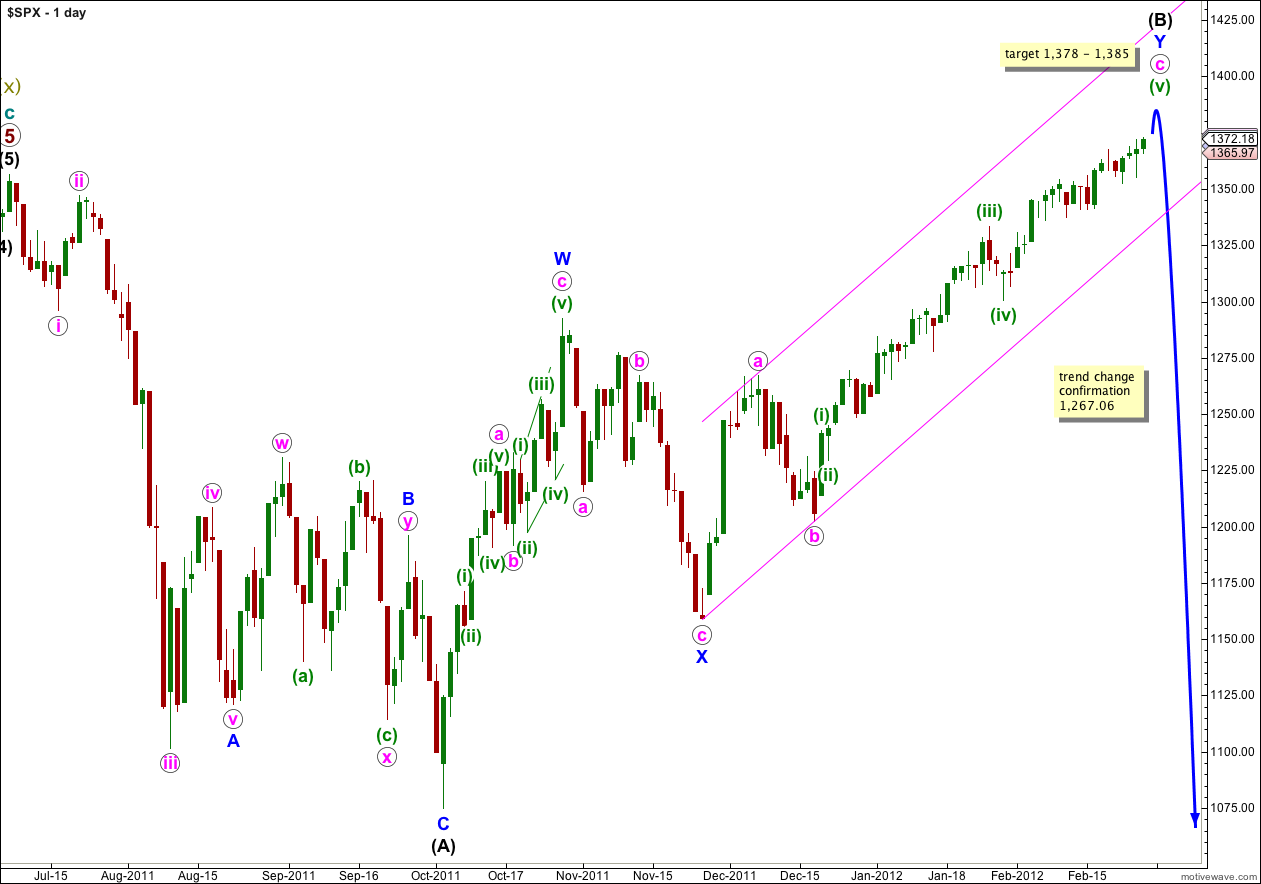
This main wave count follows on from our main historic monthly chart. It sees a flat correction at primary degree unfolding, and wave (B) black within that flat correction is probably within its last upwards wave and may end within the next 2 to 4 weeks (about).
Waves a and b pink within wave Y blue lasted a Fibonacci 8 days. Wave c pink is much longer, so far at 45 days. The next number in the Fibonacci sequence is 55, and wave c pink could possibly last another 10 trading days ending on the 9th of March, 2012 (give or take one day either side of this date). Please be aware this is a rough guideline only. While Fibonacci price ratios are commonly seen, Fibonacci time relationships are less reliable.
Wave (B) black is here labeled as a double zigzag, which is a relatively common structure. When the second zigzag labeled wave Y blue is complete the probability that wave (B) black is complete will be very high indeed. The only wave wave (B) black could continue further would be as a rare triple zigzag and the rarity of this structure means it has a very low probability.
Wave (B) black may move beyond the start of wave (A) black, and in fact for flat corrections this is most common. The maximum common length of B in relation to A within a flat is 138%. This would be achieved at 1,459. It is likely we shall see a trend change before this price point.
We may use Elliott’s channeling technique to draw a channel about wave Y blue. When this channel is breached by a full daily candlestick below it then we shall have strong confirmation of a trend change.
Wave (C) black is extremely likely to take price below the end of wave (A) black at 1,074.77.
Main Hourly Wave Count.
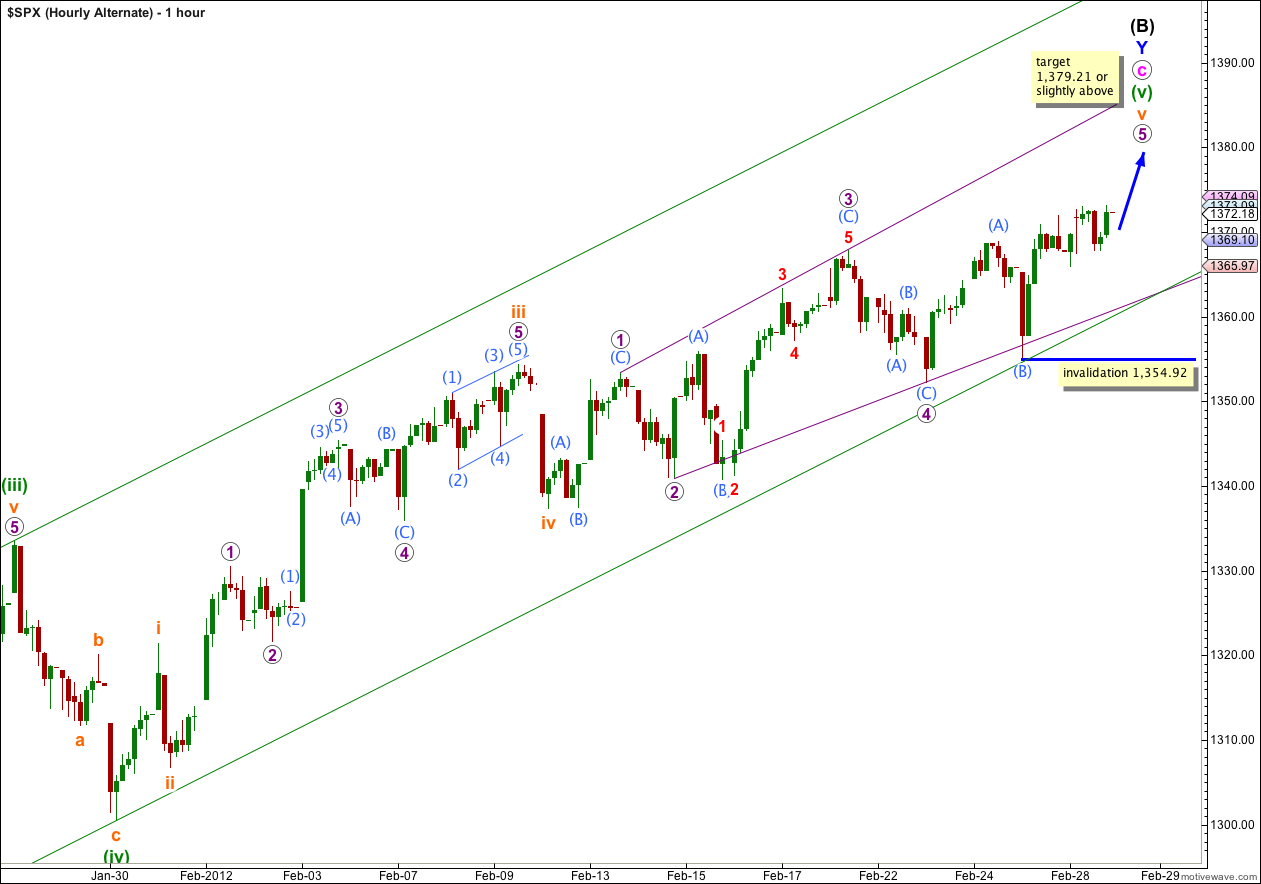
It looks like we may be seeing an ending diagonal unfold for wave v orange. This explains all the overlapping and the lack of momentum.
Thank you to Andrew Addison for sending me his chart.
This structure is correct: all subwaves of an ending diagonal must subdivide into zigzags and wave 4 purple should overlap wave 1 purple price territory.
Wave 3 purple is longer than wave 1 purple, and wave 4 purple is longer than wave 2 purple. Wave 5 purple should be at least as long as equality with wave 3 purple, and this is achieved at 1,379.21. So for this wave count price needs to reach that point or above.
At 1,382 wave (C) aqua within the zigzag of wave 5 purple would reach 1.618 the length of wave (A) aqua. This is a likely target for upwards movement to end.
If price rises to above 1,379.21 and then turns downwards, to breach this green parallel channel, then we may have seen a big trend change on the S&P 500.
Within wave (C) aqua no second wave correction may move beyond the start of its first wave. This wave count is invalidated with movement below 1,354.92.
Alternate Hourly Wave Count.
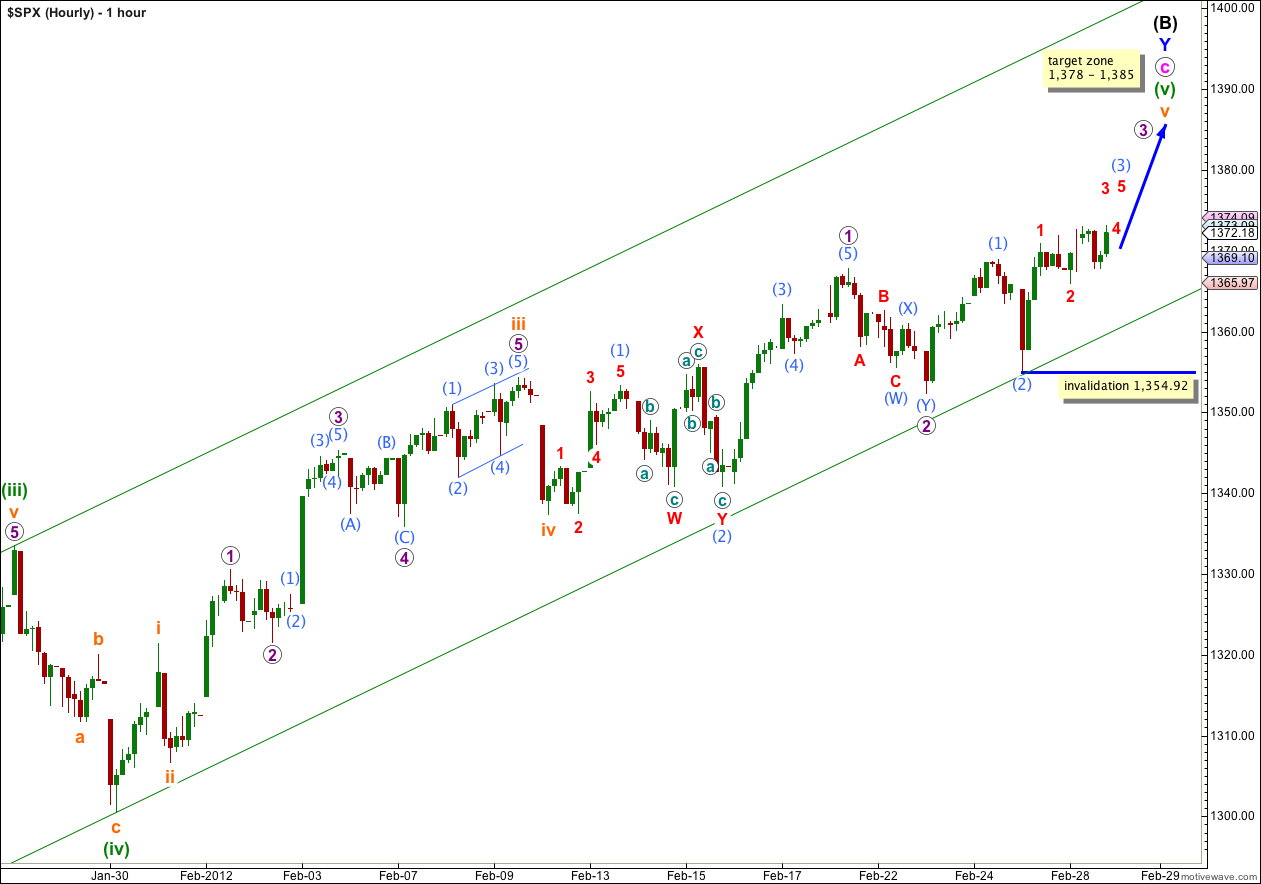
Upwards movement can be counted as another first and second wave. If this wave count is correct then we really should be seeing an increase in upwards momentum this week, and probably in the next one or two sessions.
Once wave (3) aqua is complete then we should see a series of fourth and fifth waves slowly trending upwards to complete this structure.
At 1,382 wave 3 purple would reach equality with wave 1 purple. This takes price into the target zone, and this may still work if wave 5 purple makes only a slight new high above the end of wave 3 purple. Wave c pink would still have a reasonable Fibonacci ratio to wave a pink if it was a little longer than 1,378.
At 1,378 wave c pink would reach 1.618 the length of wave a pink. At 1,385 wave v orange would reach equality in length with wave iii orange. At this stage I favour the upper end of this target zone.
When waves 3 and 4 purple within wave v orange are complete I will use Fibonacci ratios at purple degree to try to refine and narrow down this somewhat large 7 point target zone.
Waves a and b pink both lasted a Fibonacci 8 days. If wave c pink is to have a Fibonacci price relationship the next Fibonacci number in the sequence is 55. This would see it end on the 9th of March, give or take one trading day either side of this date. However, please be aware that Fibonacci time relationships are not as reliable a guide to the end of a wave as Fibonacci price ratios are. This end date is a rough guide only.
Within wave (3) aqua wave 2 red may not move beyond the start of wave 1 red. This wave count is invalidated with movement below 1,354.92
Alternate Daily Wave Count.
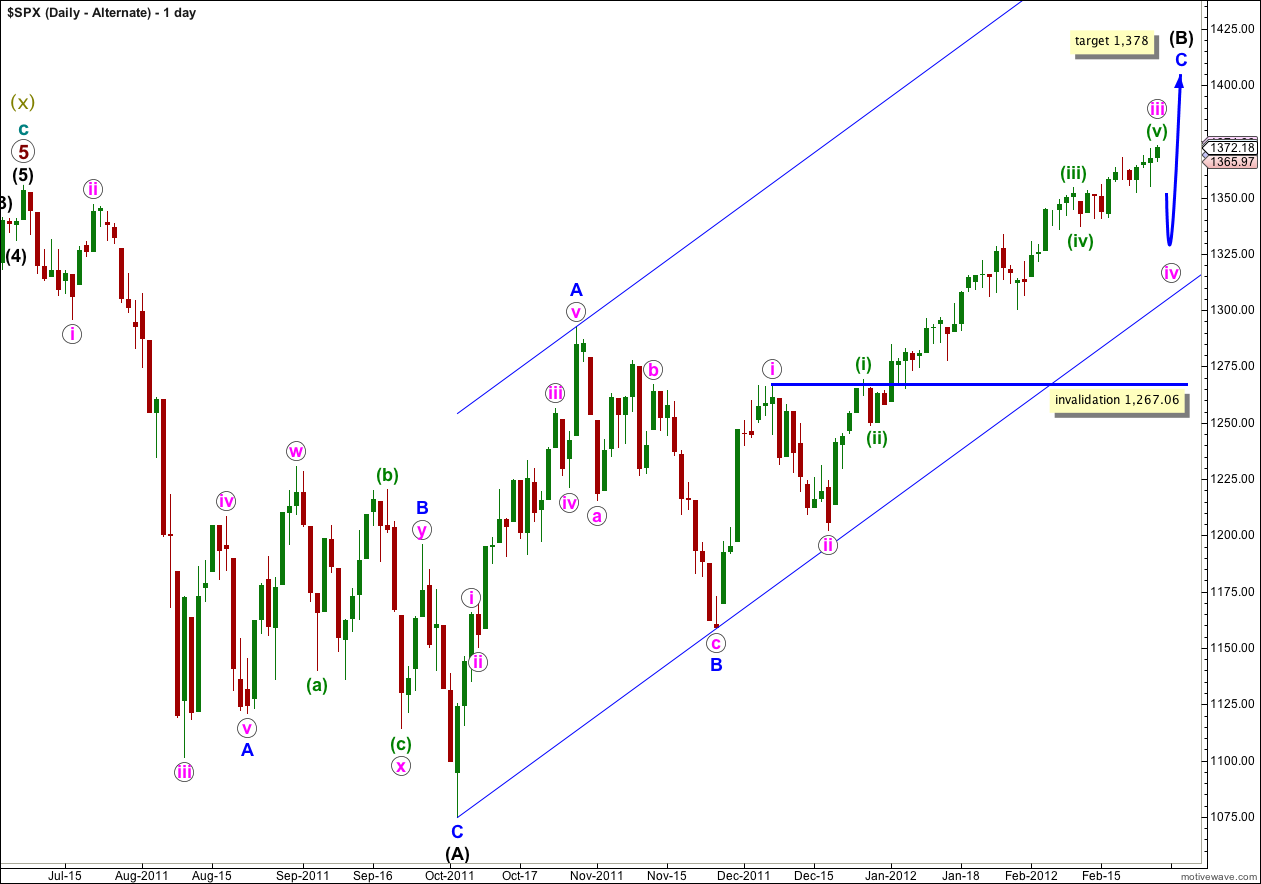
This alternate has a lower probability than the main daily chart.
If the upwards wave labeled here A blue was a five, and not a three, then wave (B) black is a single zigzag. Wave C blue is incomplete.
The subdivision of wave A blue as a five is not nearly as satisfactory as seeing it as a three, which the main wave count does. This is the reason why this alternate has a much lower probability.
It looks increasingly like wave iii pink would be incomplete. When wave iv pink begins we would expect it to last one to two weeks and be a relatively shallow correction of wave iii pink. It should look about equal in duration to wave ii pink.
Wave iv pink may not move into wave i pink price territory and this wave count is invalidated with movement below 1,267.06.
when you announce the main hourly chart you are showing the alternate, and viceversa when you announce the alternate hourly count.
On the main one, if final target for B Black is 1378, we are less than 10 points to be on that, and we have not completed 3 Blue, we are far away to complete 5 blue and farthest to 5 purple.