
As expected price has continued to move higher. We should expect this trend to continue towards our targets.
We still have two daily wave counts, but the alternate has a much lower probability. We will use the invalidation point of the alternate daily wave count to confirm a mid to long term trend change for the S&P 500. This trend change is still at least a week away I suspect, if not longer.
Click on the charts below to enlarge.
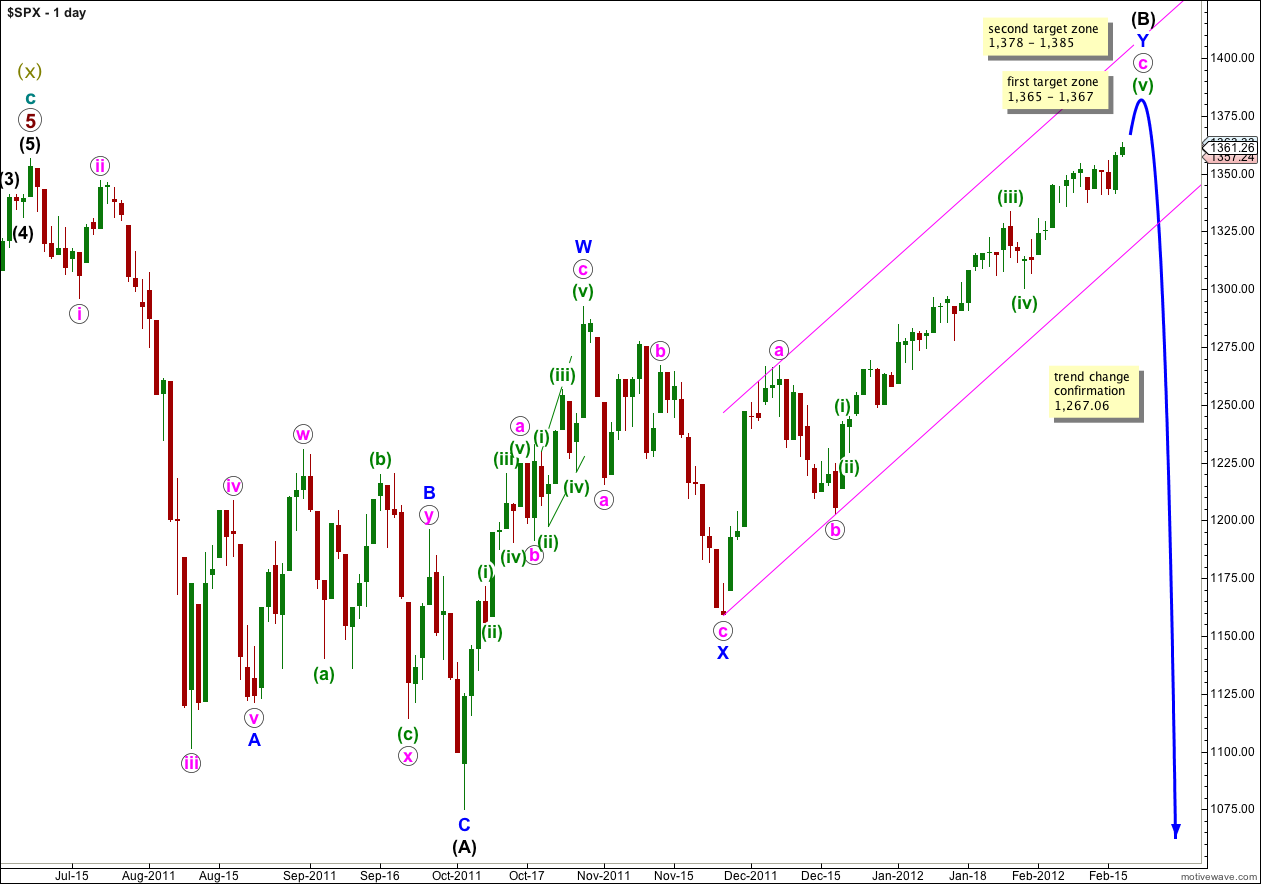
Wave c pink is extending and taking its time coming to an end. When this trend changes to the downside the only question will be whether or not downwards movement is a new trend to new lows, or just a fourth wave correction.
This main wave count has a higher probability than the alternate daily chart below because it sees wave W blue upwards as a three wave zigzag, which has a much better fit than trying to see it as a five wave impulse (the alternate idea).
Wave (B) black may move beyond the start of wave (A) black, and in fact for flat corrections this is most common. The maximum common length of B in relation to A within a flat is 138%. This would be achieved at 1,459. It is likely we shall see a trend change before this price point.
When wave (B) is complete then wave (C) must unfold in five waves down, as either an impulse or an ending diagonal. An impulse is the most likely and is easier to analyse. Wave (C) black does not have to make a new low below the end of wave (A) black, but it is extremely likely to do so.
There is unfortunately no clear Elliott wave rule regarding the length of wave (B) in relation to wave (A) for a flat correction. If price continues above 1,469 then this wave count would not be invalidated, but the probability would reduce significantly.
Movement below 1,267.06 would invalidate the alternate daily chart below and confirm this main wave count. At that stage we may have confidence that the S&P 500 has seen a trend change.
Movement below the parallel channel containing the zigzag for wave Y blue would also provide some indication of a trend change.
Main Hourly Wave Count.
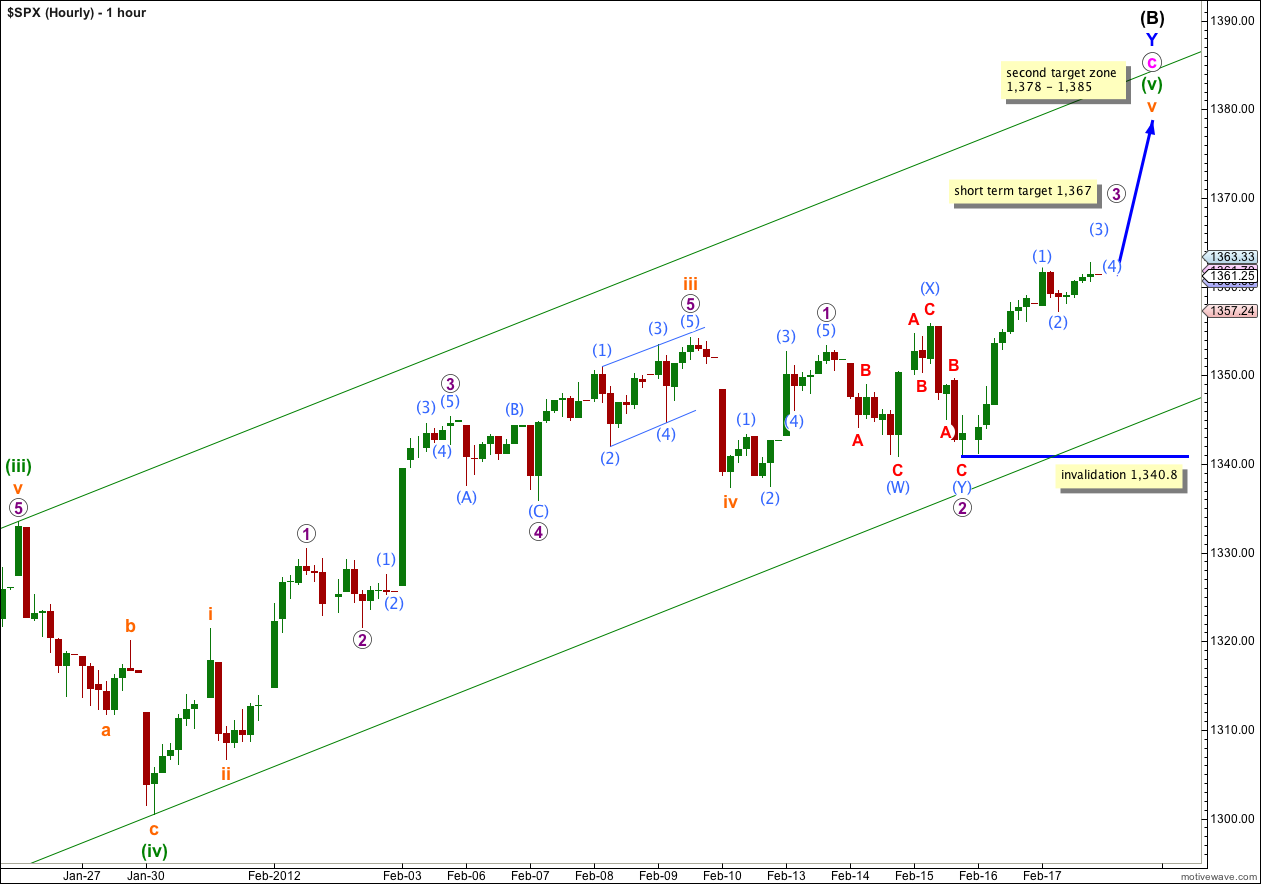
There are two different ways to see most recent upwards movement. Wave 3 purple may be extending, and this is the first hourly wave count above.
At 1,367 wave 3 purple would reach 1.618 the length of wave 1 purple. About this short term target we may expect a small trend change and some sideways and slightly lower movement for a fourth wave.
At this stage within wave 3 purple wave (2) aqua may not move beyond the start of wave (1) aqua. This wave count is invalidated with movement below 1,340.8.
At 1,378 wave c pink would reach 1.618 the length of wave a pink. At 1,385 wave v orange would reach equality with wave iii orange. This gives us a 7 point target zone for the upwards trend to end.
Alternate Hourly Wave Count.
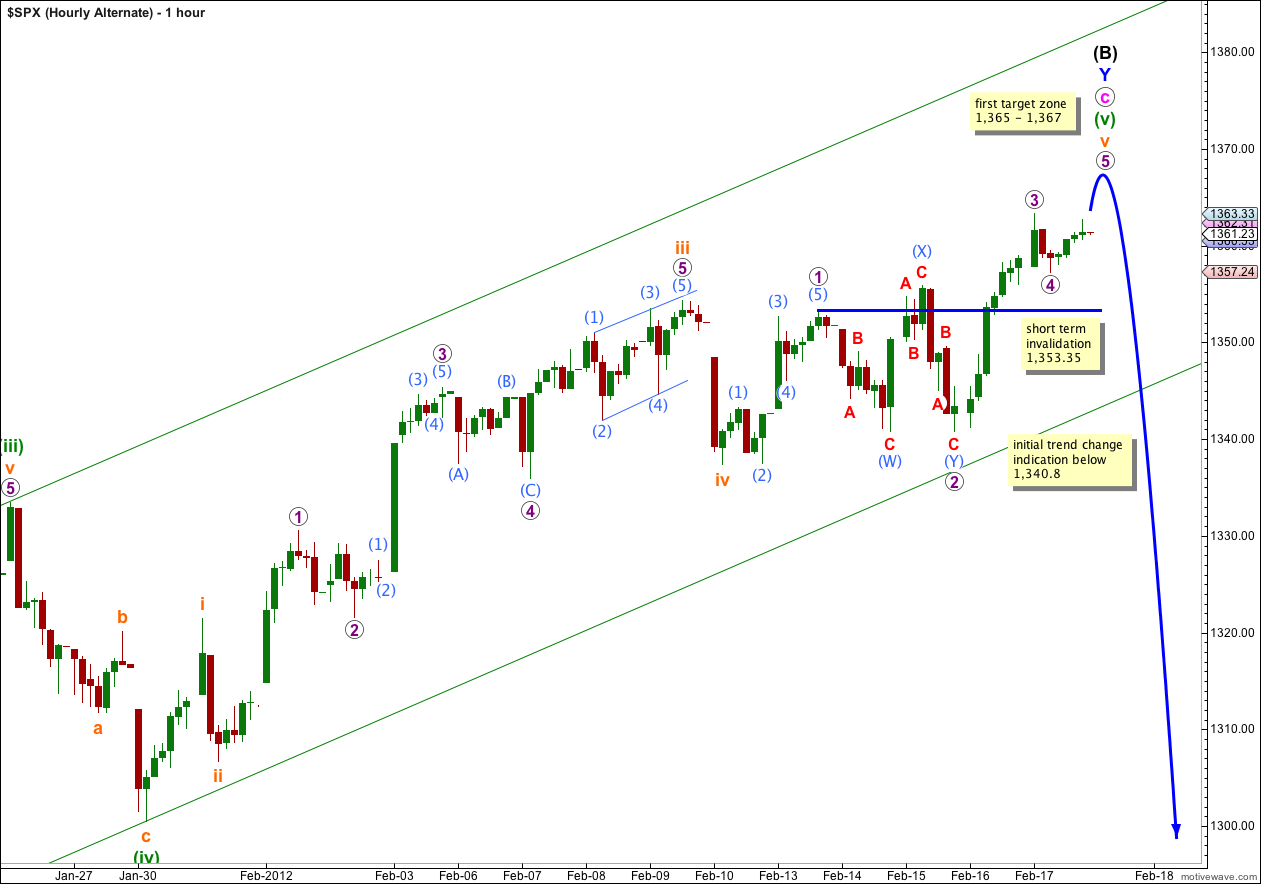
Another way of looking at the most recent upwards movement is as a completed third wave and fourth wave correction.
Wave 3 purple has no Fibonacci ratio to wave 1 purple. Wave 4 purple is out of proportion to wave 2 purple, but there is alternation between the two and wave 4 has remained out of wave 1 price territory. At these very low wave degrees on an hourly chart waves will not always be in proportion. It gives this wave count a slightly odd look, but not unprecedented and not so strange as to be unlikely. It looks reasonable to me.
At 1,365 wave (v) green would reach 0.618 the length of wave (iii) green. At 1,367 wave v orange would reach 0.618 the length of wave iii orange. And also at 1,367 wave 5 purple would reach 0.618 the length of wave 1 purple. For this wave count the 2 point target zone has a high probability.
If price moves a little higher into our target zone (and 1,367 has a very high probability of being reached) and then turns back down strongly this wave count will have the right look. At that stage movement below 1,340.8 would provide an indication that we may have had a trend change.
In the very short term before wave 5 purple is complete, any further extension of wave 4 purple may not move into wave 1 purple price territory. This wave count is invalidated with movement below 1,353.35.
Alternate Daily Wave Count.
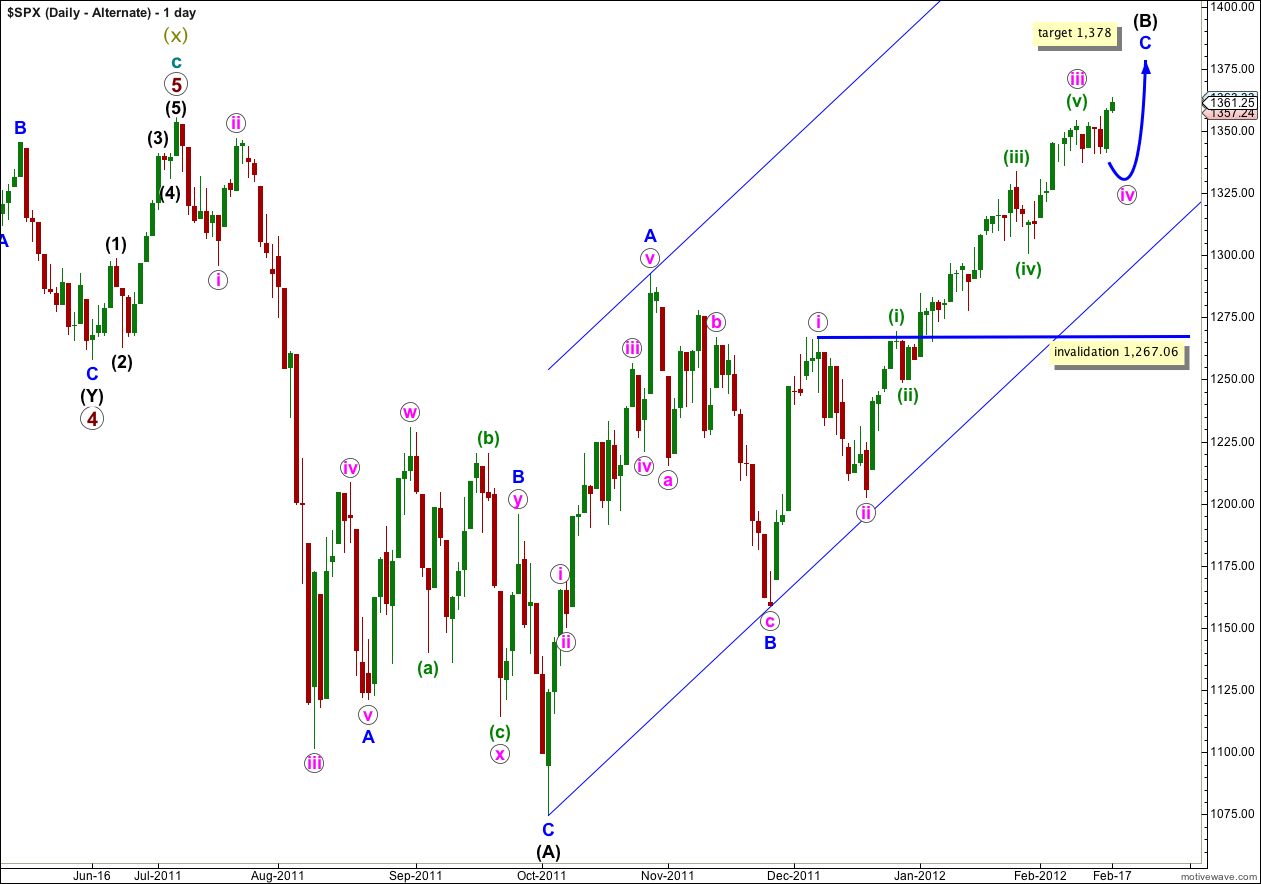
This alternate has a lower probability than the main daily chart.
If the upwards wave labeled here A blue was a five, and not a three, then wave (B) black is a single zigzag. Wave C blue is incomplete.
Wave iii pink is most likely now complete and wave iv pink is underway. Wave iv pink may last about one to two weeks. At this stage it looks like wave iv pink may move price mostly sideways as a flat correction, or a combination beginning with a flat.
Wave iv pink may not move into wave i pink price territory and this wave count is invalidated with movement below 1,267.06.
Hi Lara, NYSE is closed Monday for President’s Day holiday