
The S&P 500 has made a slight new high and closed close to where it opened. With more short term structure now clearer and complete I can refine the target for this movement to end.
With the long held “primary 2 – 3” wave count of Prechter’s now firmly invalidated by the Dow, I expect the S&P 500 to follow suit. The monthly wave count I’m now using is one I’m comfortable with as all the subdivisions fit perfectly, each wave has behaved as expected, and the structure for grand super cycle degree is a reasonably common one.
I have another, more bullish, monthly chart alternate for you today. It has a lower probability simply because the structure is a rare one.
Click on the charts below to enlarge.
So far throughout wave c pink upwards there is little divergence on hourly charts or time frames above. The structure continues to unfold, and it’s still not done.
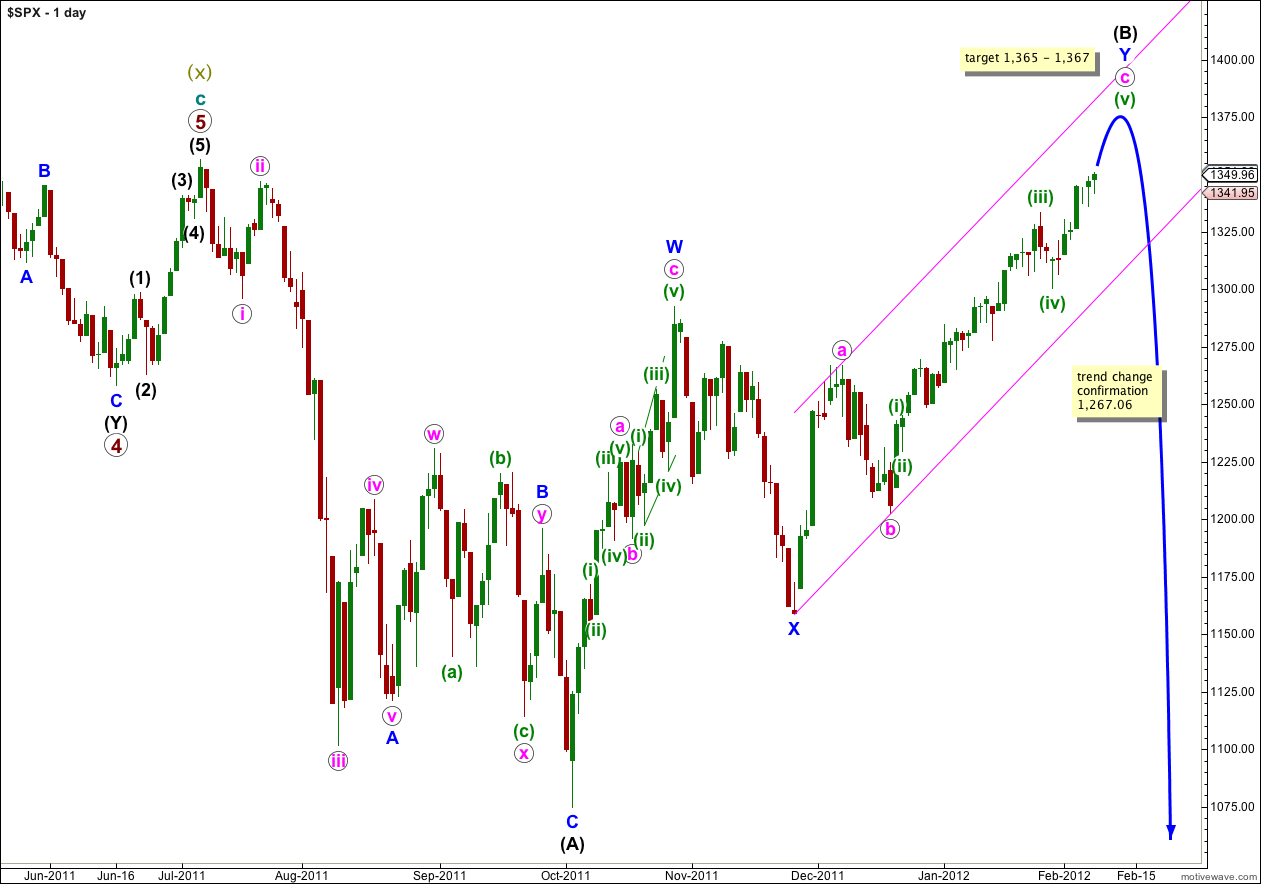
Wave (B) black may move beyond the start of wave (A) black, and in fact for flat corrections this is most common. The maximum common length of B in relation to A within a flat is 138%. This would be achieved at 1,469. It is likely we shall see a trend change before this price point.
When wave (B) is complete then wave (C) must unfold in five waves down; either an impulse or an ending diagonal. An impulse is the most likely and is easier to analyse. Wave (C) black does not have to make a new low below the end of wave (A) black, but it is extremely likely to do so.
There is unfortunately no clear Elliott wave rule regarding the length of wave (B) in relation to wave (A) for a flat correction. If price continues above 1,469 then this wave count would not be invalidated, but the probability would reduce significantly.
Movement below 1,267.06 would invalidate the alternate daily chart below and confirm this main wave count. At that stage we may have confidence that the S&P 500 has seen a trend change.
Movement below the parallel channel containing the zigzag for wave Y blue would also provide some indication of a trend change.
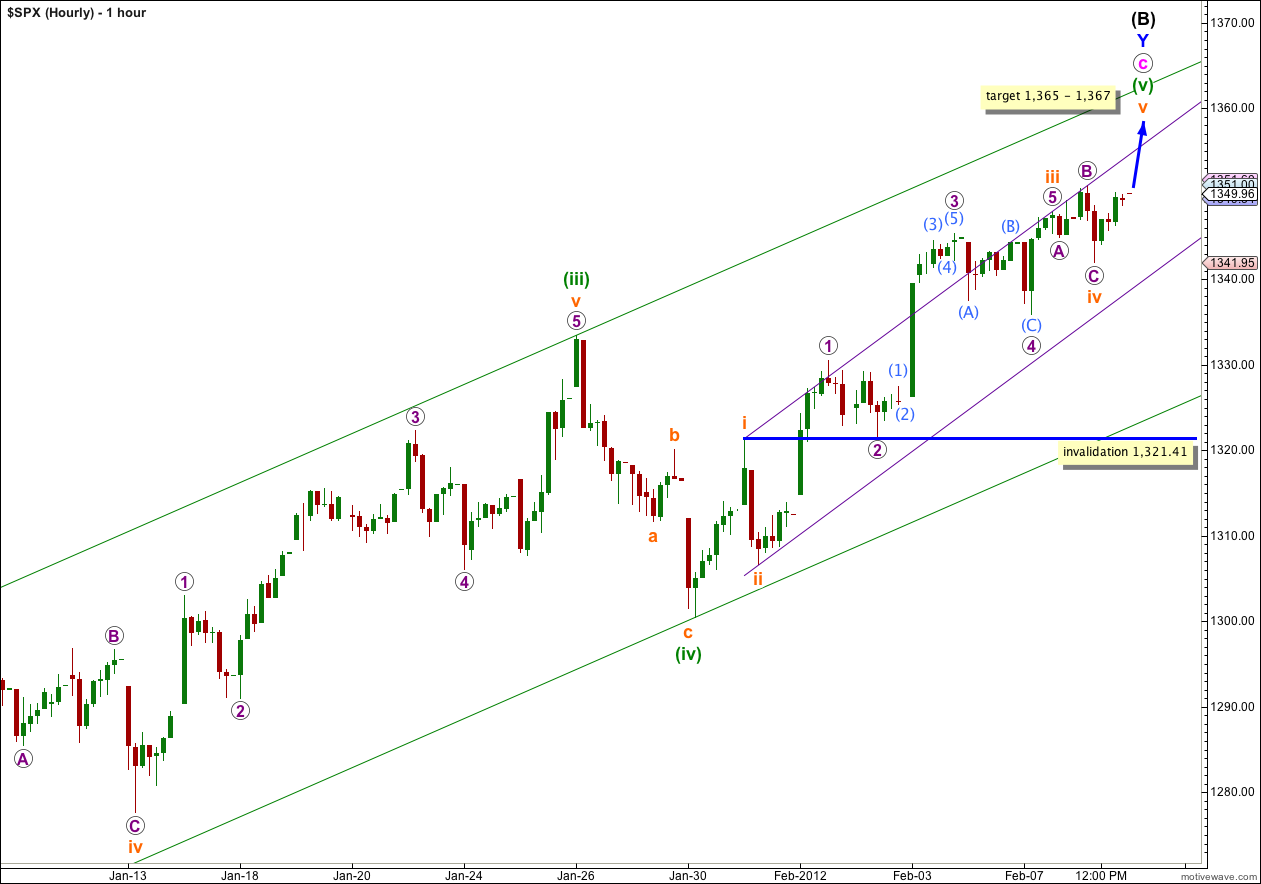
It looks like wave iii orange is over already, and Wednesday’s downwards movement was wave C purple of wave iv orange. This fits nicely within the small channel for wave (v) green.
Wave ii orange was a sharp deep zigzag and wave iv orange is a shallow expanded flat, achieving the guideline of alternation nicely.
There is no Fibonacci ratio between waves iii and i orange and it is more likely we shall see a Fibonacci ratio between wave v orange and either of i or iii. At 1,367 wave v orange would reach 0.618 the length of wave iii orange.
At 1,365 wave (v) green would reach 0.618 the length of wave (iii) green. This gives us a 2 point target for upwards movement to end.
At this stage any further continuation of wave iv orange, as a double flat or double combination, may not move into wave i orange price territory. This wave count is invalidated with movement below 1,321.41.
Daily Alternate Wave Count.
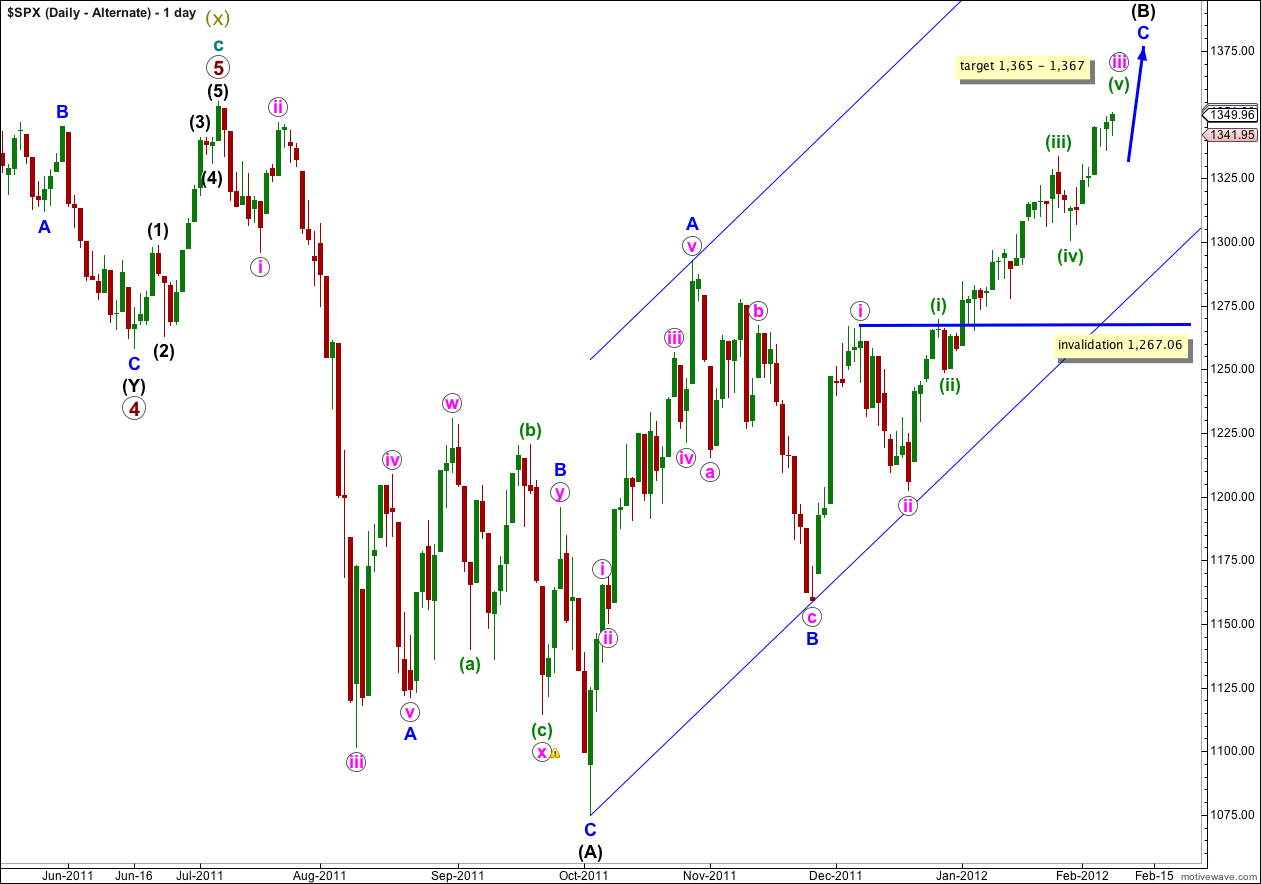
This alternate has a lower probability than the main daily chart, but we must consider it.
If the upwards wave labeled here A blue was a five, and not a three, then wave (B) black is a single zigzag. Wave C blue is incomplete.
When wave iii pink is complete then wave iv pink should unfold, lasting one to two weeks. Wave iv pink may not move into wave i pink price territory and this wave count is invalidated with movement below 1,267.06.
Alternate Monthly Wave Count.
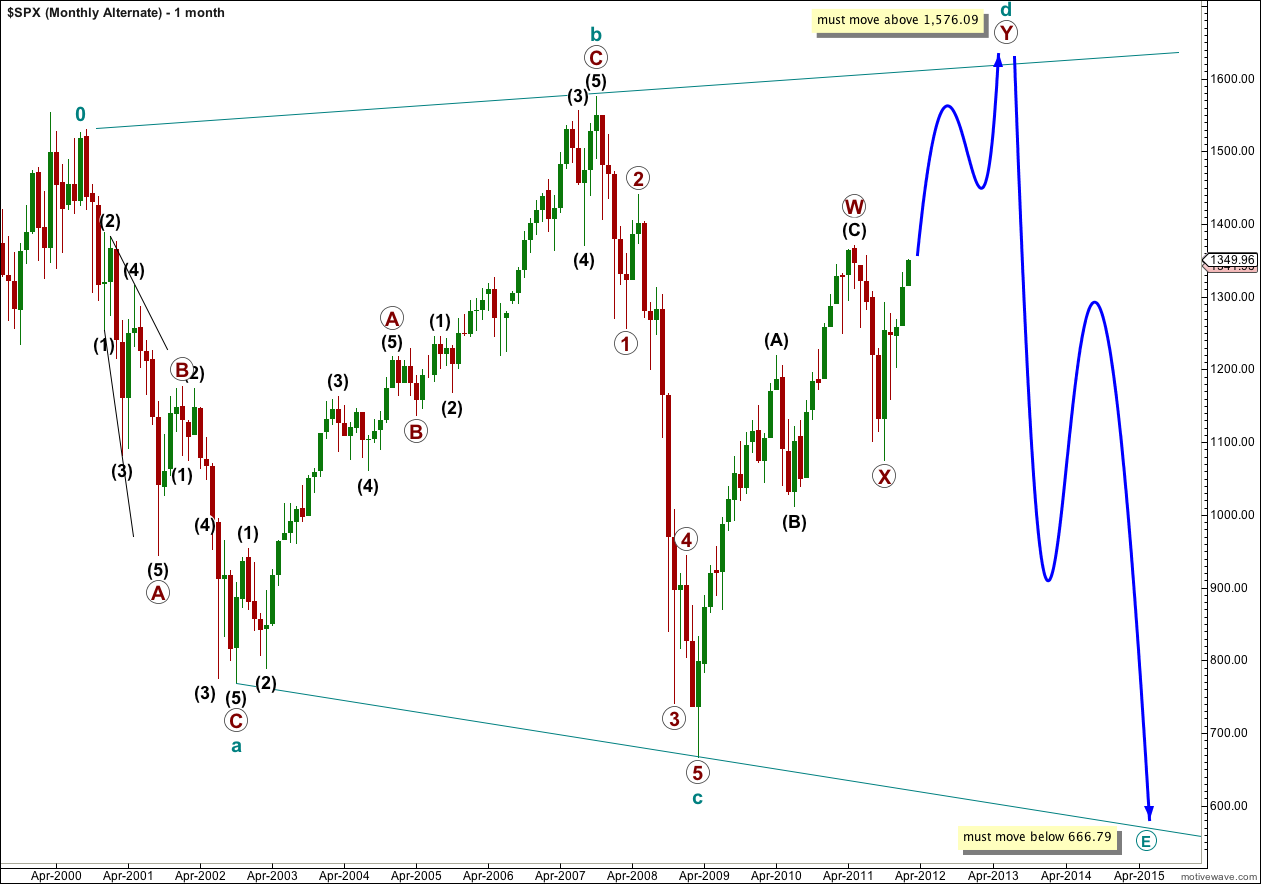
It is possible that at super cycle degree we are seeing a very rare expanding triangle unfold.
I have seen many times what looks like to be a triangle unfold as all the subdivisions are correct and each wave seems to unfold as expected, and then right up until the very last minute it invalidates itself and turns out to not be a triangle but a double flat or double combination. For this reason I am always wary now of relying upon triangles and I will always look for an alternate. We would only know for sure that this wave count is correct when wave E is finished.
Furthermore, expanding triangles are reasonably rare structures. I have only seen a very few of them.
However, with that caution in mind this is an entirely valid wave count. The subdivisions all fit.
One of the five subwaves of a triangle does not have to be a three wave structure, and cycle wave c may have been an impulse. However, although this adheres to triangle rules it is a little unusual to see an impulsive wave within a triangle. This further slightly reduces the probability that this wave count is correct.
One of the five subwaves of a triangle should be longer lasting and more complicated than the others, and cycle wave d would be unfolding as a double zigzag.
The triangle must be expanding because cycle wave c moved beyond the end of cycle wave a. Wave d must move beyond the end of wave b, and wave e must move beyond the end of wave c.
If price continues in the short to mid term to rise and moves above 1,468 then this wave count would increase in probability. At that stage it would be my primary wave count, but not before.
thank you very much !!