
The Dow has broken above 12,876 and I expect what was our main wave count for the S&P 500 would be invalidated. I am switching today to the alternate wave count developed over the weekend, and this is our only wave count now.
The mid to long term outlook is still reasonably bearish, but I think we are now looking at a series of three wave structures each lasting months. Actionary waves are still trending downwards and will probably see the greatest momentum, but upwards corrections should continue to be deep, at least 90% of the downwards falls, and they may even make new price extremes.
The new monthly chart is published below.
Click on the charts below to enlarge.
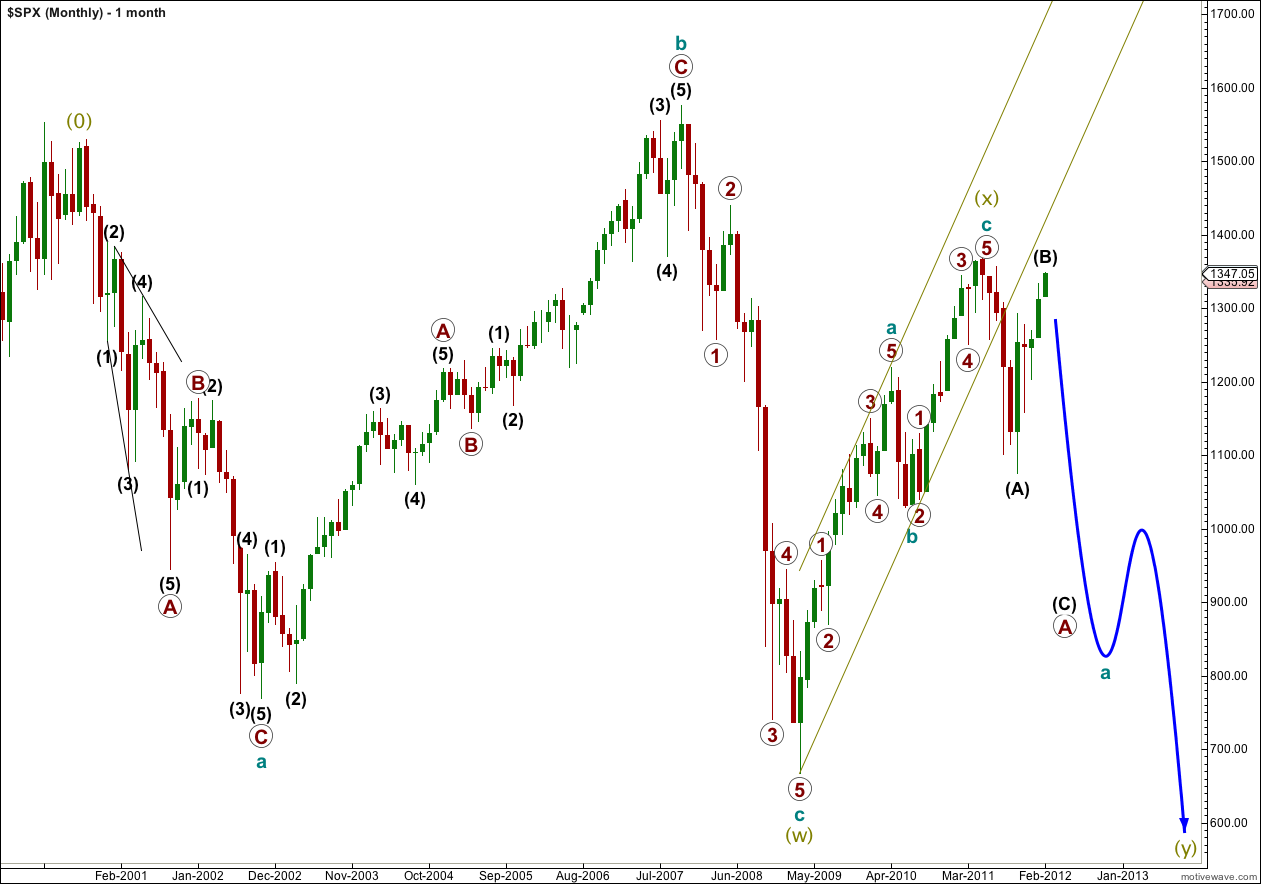
The very big picture is unchanged and it is the structure of super cycle wave (y) which is now clearer.
Cycle wave a is most likely subdividing into a flat correction because primary wave A is subdividing into a flat correction also.
Wave (B) black may move beyond the start of wave (A) black, and in fact for flat corrections this is most common. The maximum common length of B in relation to A within a flat is 138%. This would be achieved at 1,469. It is likely we shall see a trend change before this price point.
When wave (B) is complete then wave (C) must unfold in five waves down; either an impulse or an ending diagonal. An impulse is the most likely and is easier to analyse. Wave (C) black does not have to make a new low below the end of wave (A) black, but it is extremely likely to do so.
There is another possibility that super cycle wave (y) could unfold as a triangle. We will not know this is the case for a couple of years.
I would expect super cycle wave (y) to last 7 to 10 years as it should be reasonably in proportion to wave (w) which lasted 9 years.
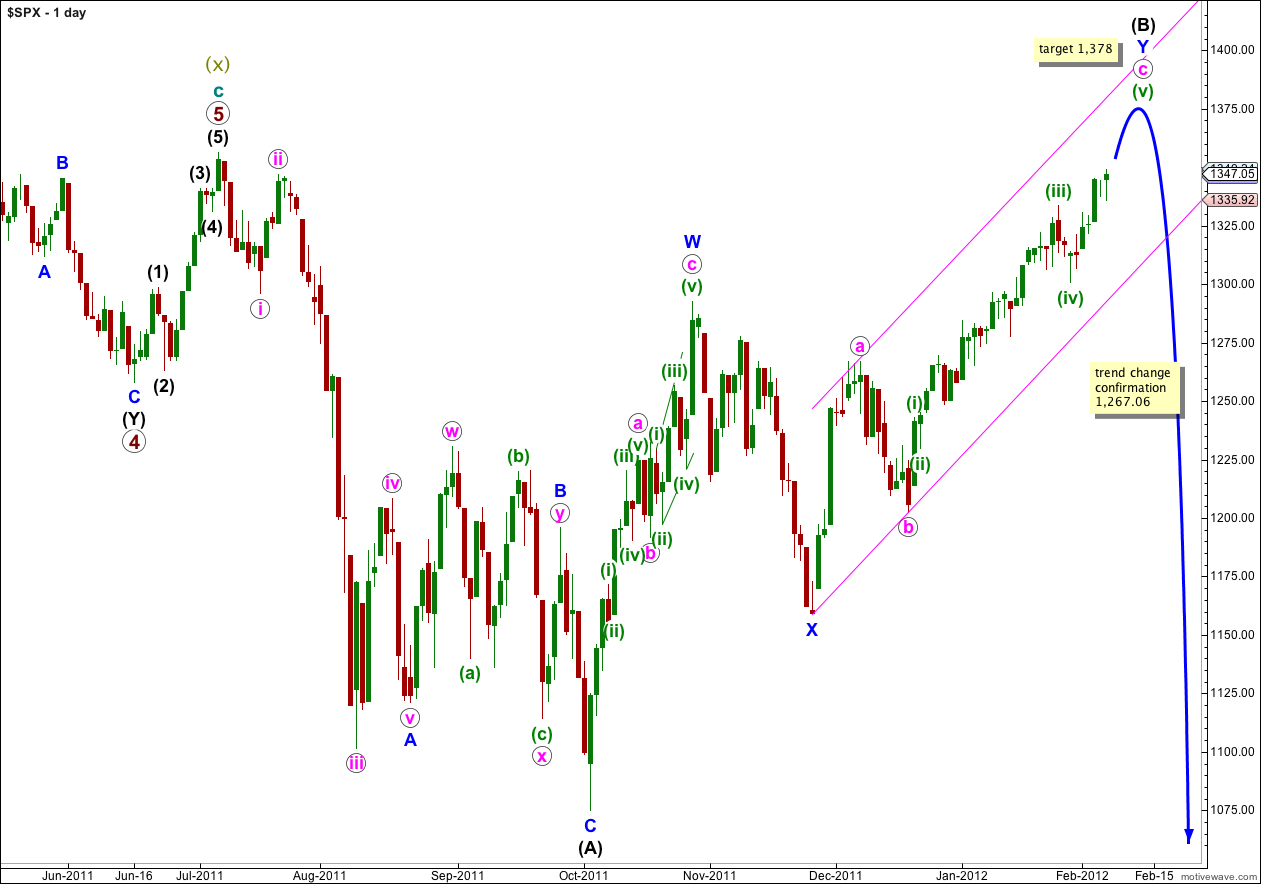
On the daily chart there are two ways to see the subdivisions of wave (B) black. This first wave count sees it as a double zigzag. This is my main wave count because the subdivisions within wave W blue fit a zigzag better. This has a higher probability than the daily alternate below.
At 1,378 wave c pink within wave Y blue would reach 1.618 the length of wave a pink. As wave c pink has now passed equality with wave a pink this is the next expected target. This would see wave (B) black end just over 105% the length of wave (A) black and primary wave A would be an expanded flat correction, the most common type of flat.
Movement below 1,267.06 would invalidate the alternate daily wave count below, and would provide strong confirmation of a trend change. At that stage we should expect wave (B) black is over and wave (C) black would likely take price to new lows below (A) black at 1,075.
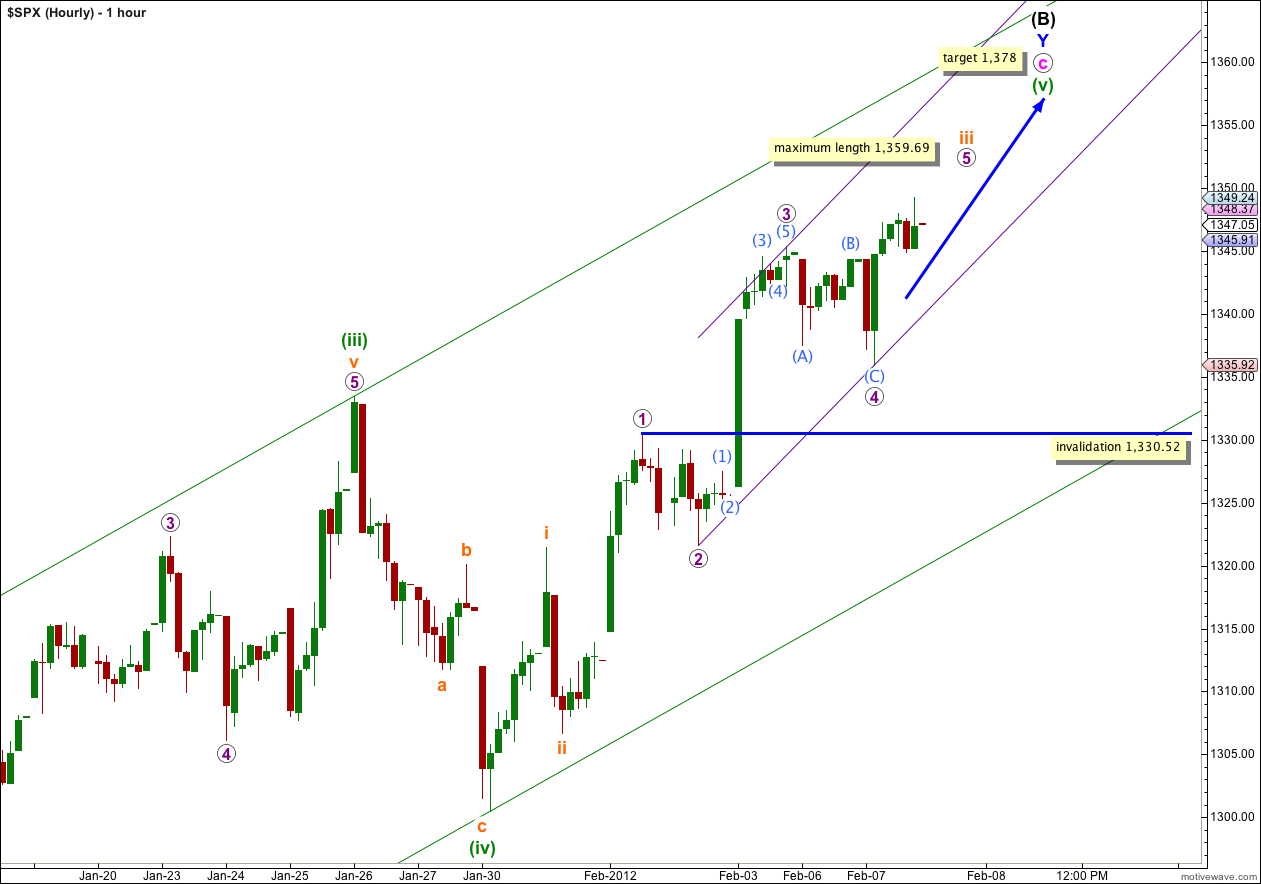
The green parallel channel drawn here is exactly the same as we have been using for weeks now and it should continue to be useful for us.
The smaller parallel channel is drawn using Elliott’s second technique about wave iii orange. Draw the first trend line from the lows of 2 to 4 purple, then place a parallel copy upon the high of 3 purple. Wave 5 purple may end either mid way in this smaller channel, or about the upper edge.
Within wave (v) green, the final upwards wave of wave c pink, wave iii orange is extending. At 1,361 wave iii orange would reach 2.618 the length of wave i orange. It may end very close to this point, just below about 1,359.69 but not above. Within wave iii orange wave 3 purple is very slightly shorter than wave 1 purple. Because third waves may never be the shortest within an impulse this means wave 5 purple is limited to no longer than equality with wave 3 purple. This gives us a maximum limit for wave iii orange at 1,359.69. We should see a correction begin for wave iv orange just before this point.
Wave (v) green may end about the upper edge of the wider green parallel channel.
Any further extension downwards of wave 4 purple may not move into wave 1 purple price territory. This wave count is invalidated with movement below 1,330.52.
In one more trading day wave c pink would have lasted a Fibonacci 34 days. It is possible that it may end after this day, but it seems unlikely.
Alternate Daily Wave Count.
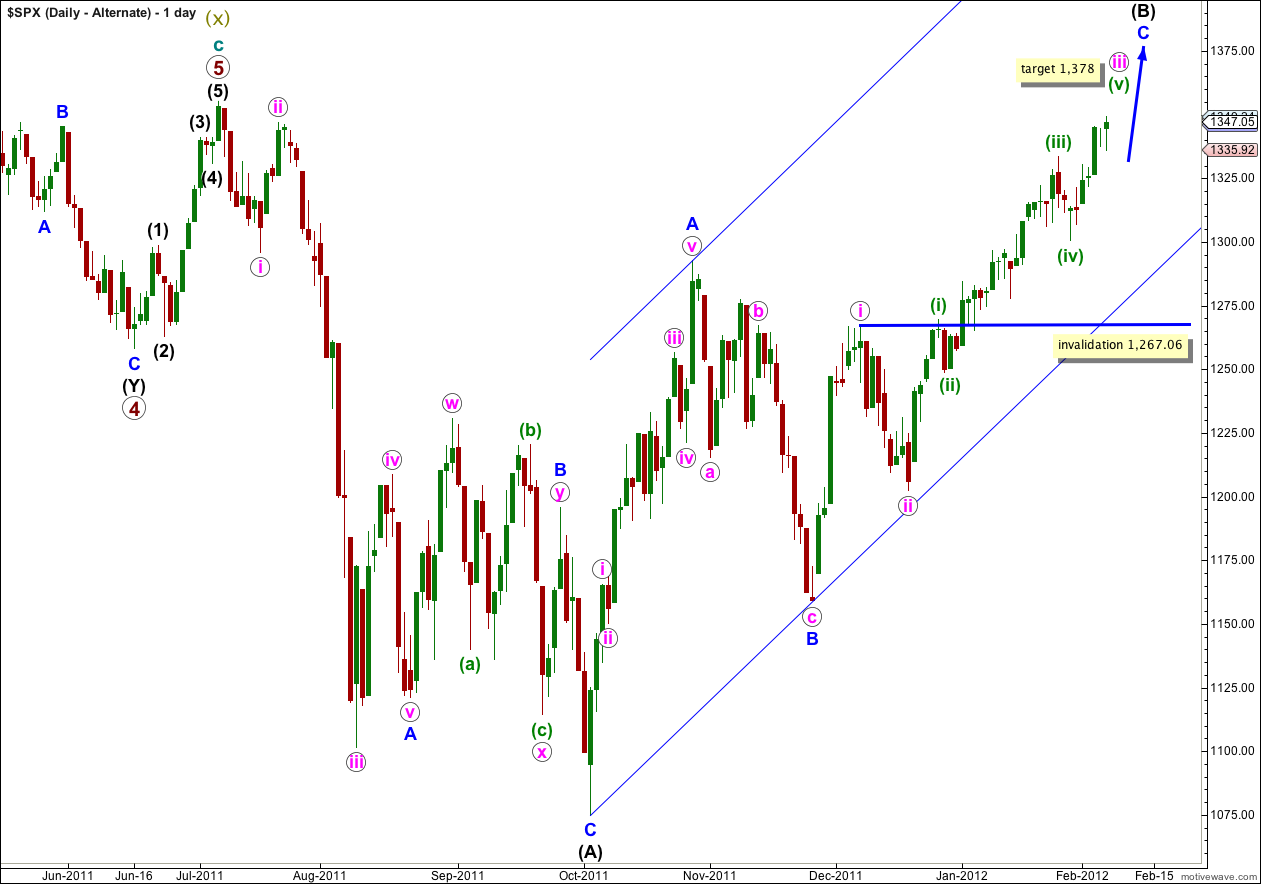
If we see the upwards wave labeled A blue within (B) black as a five wave structure rather than a three, then wave (B) black would be unfolding as a simple zigzag rather than as a double zigzag.
The subdivisions within wave A blue are less satisfactory than for the main wave count and this is why this alternate has a lower probability. I am considering it only because it offers the possibility of more and longer lasting upwards movement, and it also offers a clear invalidation / confirmation point.
An upcoming wave iv pink may not move into wave i pink price territory. Movement below this price point, 1,267.06, would invalidate this alternate and provide strong confirmation of a trend change.
At 1,378 wave iii pink would reach 1.618 the length of wave i pink.
When waves iii and iv pink are complete then I would calculate a target upwards for wave v pink to complete wave C blue and wave (B) black in its entirety.
Lara,
I sent you an email (using the Contact option), about a bullish option for EW. Thank you very much in advance. I will appreciate if you have any comment about it.
Thanks, and I’ve checked it out.
It looks really very good and I’ll be publishing this very bullish idea for members shortly.
Lara,
If it is a 2, does that imply that the end of super cycle y will signal the beginning of a major bull market for grand super cycle wave III?
Peter
Yes, it does.
But that’s 7-10 years away.
target price is going up for months…
Lara,
When super cycle wave y ends, will that mark the end of grand super cycle wave IV? Just trying to keep the very big picture in mind. Thanks.
Peter
Yes, if this is the correct wave count, that should be the end of it
although I have not labeled this at grand super cycle as either a wave 2 or 4, and for the S&P 500 I would expect it would more likely be a 2