
The S&P 500 has moved sideways in a narrow range for Thursday’s session. Price has failed to break below our confidence point and until it does that I will have concerns about this wave count. However, price remains below the invalidation point and the wave count remains valid.
Click on the charts below to enlarge.
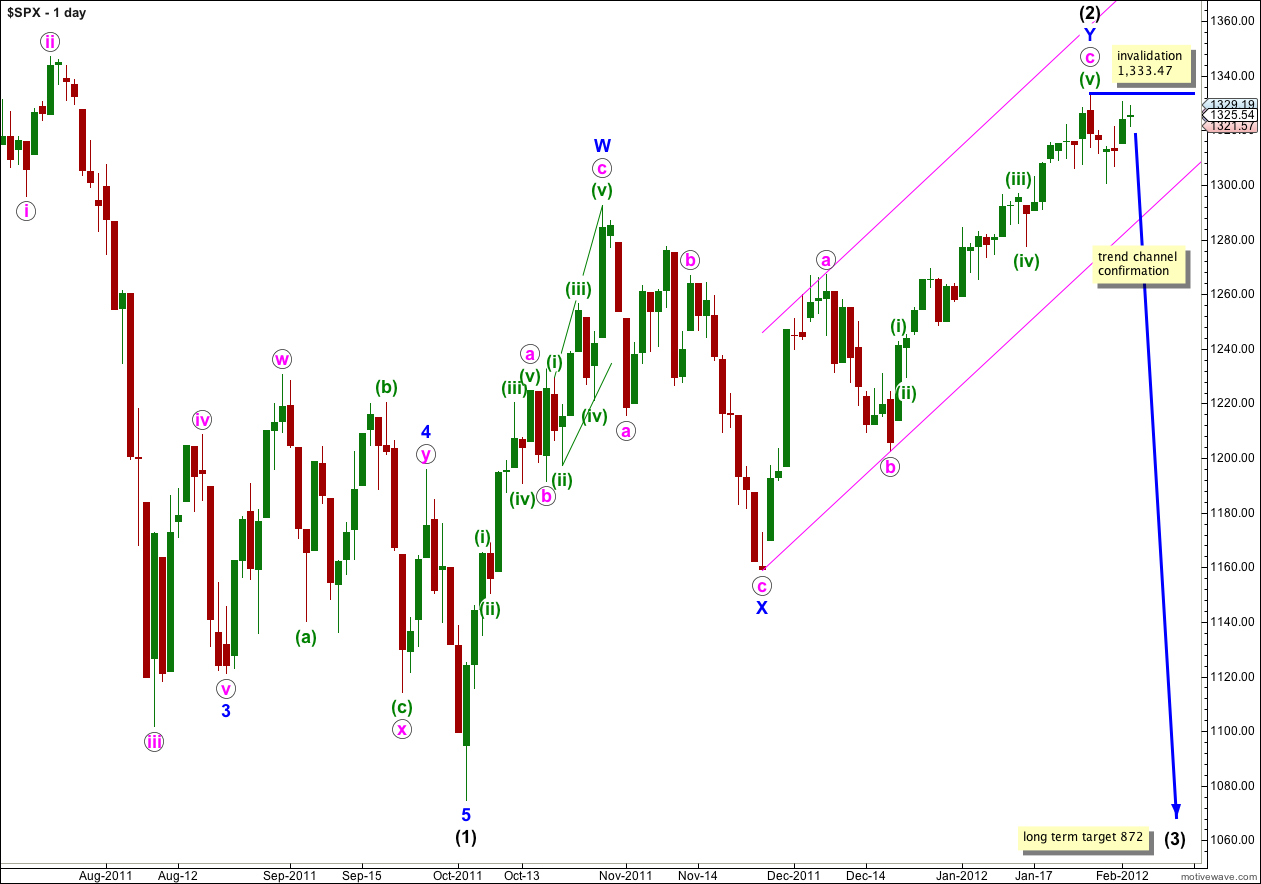
Price moved in a very small range, less than 8 points, for Thursday’s session. The bigger picture is unchanged from yesterday.
Wave (3) black would reach 1.618 the length of wave (1) black at 872 and this long term target is months away. Wave (1) black lasted 4 months and wave (2) black lasted 3 months. We may expect wave (3) black to last at least 2 months and possibly longer.
When the parallel channel containing wave Y blue zigzag is breached by downwards movement then we shall have final confirmation of this big trend change. Now that it is more likely that a leading diagonal is unfolding in a first wave position this trend channel confirmation is likely a little longer away than initially expected; normally diagonals take longer to unfold than impulses.
Wave (2) black is labeled here as a double zigzag structure, which is relatively common. The only way wave (2) black could continue further sideways when the second zigzag of Y blue is over is as a rare triple zigzag. The rarity of triples means this has a very low probability. Furthermore, the purpose of triple zigzags is to deepen corrections. Wave (2) black is already a very deep correction of wave (1) black and it does not need to be deepened further.
The probability that wave (3) black has begun is very high.
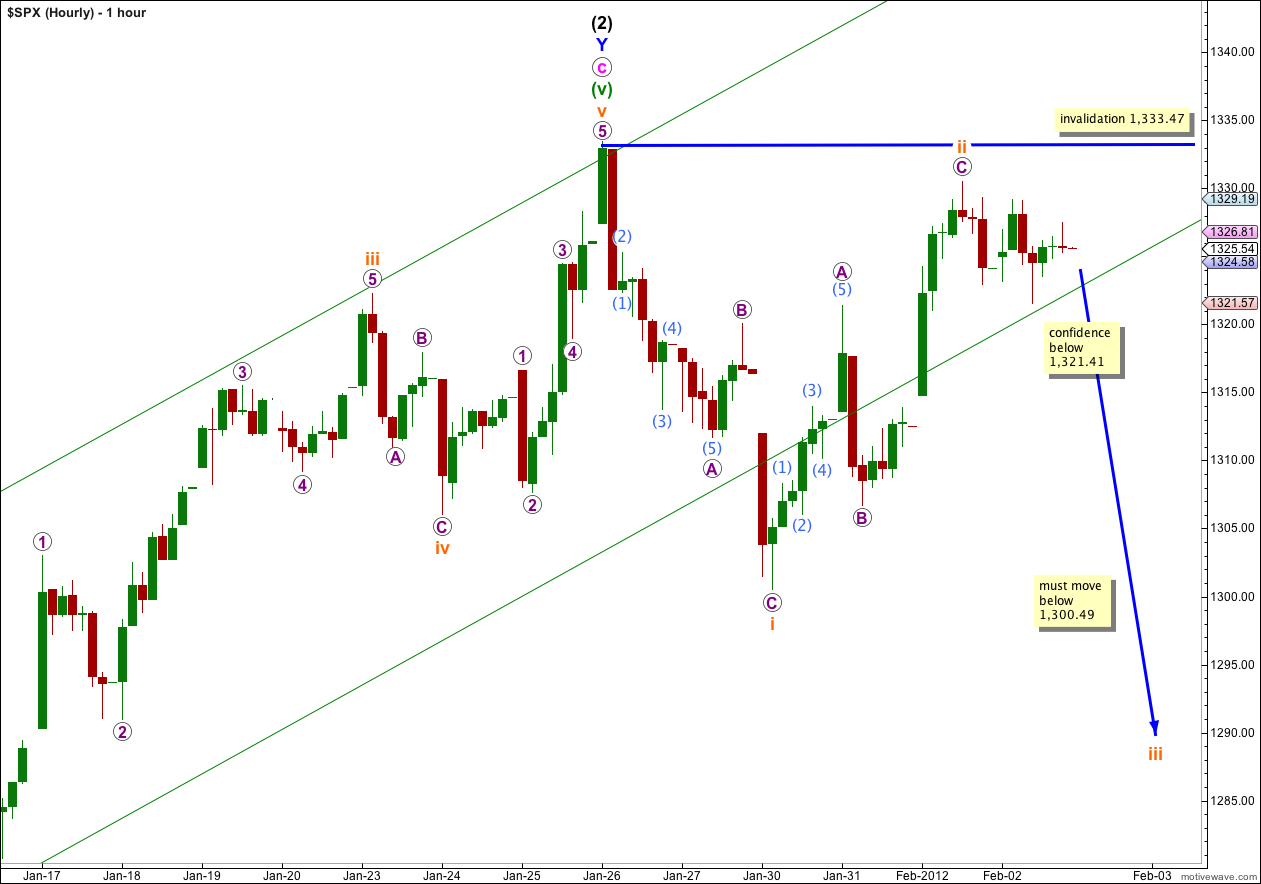
I am concerned that in downwards movement for Thursday price failed by the narrowest of margins to move below 1,321.41, reaching only down to 1,321.57. However, this may have been because the lower edge of this parallel channel provided support for downwards movement at that point.
If this wave count is correct then tomorrow we should see movement below 1,321.41 which would provide confidence in this wave count.
Trend channels for Thursday’s movement on the 5 minute chart suggest that tomorrow we should see further downwards movement from market open.
So far movement downwards from the high labeled ii orange subdivides neatly on the 5 minute chart as 5-3-5. This would be labeled 1-2, 1 for this wave count but my concern at this stage is that it also subdivides neatly as a zigzag. They have the same subdivisions. Thus, it still could be a fourth wave correction of a new impulsive movement upwards which could make a new high.
If 1,333.47 is breached tomorrow then look to the Dow. If the Dow has moved above 12,876 then we will use my second alternate historic analysis; this is a very significant invalidation.
If price moves below 1,321.41 tomorrow then I will have increased confidence in this wave count. At that stage expect price to continue falling to below 1,300.49.
Hi Lara,
I really enjoy the analysis that you do. Seems like quite a bit of work!
I was wondering what an Eliott Wave analysis of the NYSE might suggest. Since it is an index encompassing a wide range of stocks, about 3500 to 4000 I think, as opposed to the Dow or S&P, it would be interesting to see what it’s “barometer” is suggesting. I think the content and weighting also changes within the Dow and S&P, what effect do you think that might have on interpretations? Have you ever looked at the NYSE?
Thanks
Dave
Hi Dave,
Nope, I’ve never looked at the NYSE mostly because the data feed I’m using from Bar Charts with Motive Wave doesn’t have it.
It would be an interesting barometer, and it would probably be more accurate than either the S&P 500 or the Dow simply because it would have greater volume.
I find the S&P 500 tends to have better EW structures and Fibonacci ratios than the Dow, it has a more typical look.
Continually amazed all right!
My view is low volume markets enable big banks/superfunds/brokerage firms/FED reserve to be in a better position to control market price how they like. When volume increases they don’t have this control and the market is free to express overall sentiment. Consequently, high volume reduces these narrow misses of critical resistance and the market is less driven by ‘spin’.
I am continually amazed that we can trade billions of shares and miss a critical breakdown target by .16. I had setup my second group of shorts just below that target. This may portend the start of a wave 5. Lara, If you were to speculate, what would be a reasonable target for a speculative wave 5 to end?
Michael, I don’t want to calculate an upwards target for a scenario which I think has a very low probability. I’d rather leave it with only a target for more likely downwards movement calculated.
But it you really want to, you can calculate a target based upon 5=1 in length.
Yes, I’m amazed that the confidence point was missed by 0.16 also, and that has me worried.
I appreciate you misgivings as well as your insights.