
Currently I have three wave counts on monthly charts. The first two differ only in the structure of the next movement as they are both expecting the same downwards direction to new lows.
The second alternate I have developed in response to requests from members. However, the alternate has a couple of problems which reduce its probability to very low, in my estimation. It also expects downwards movement from this point, but this does not necessarily have to make a new low. It allows for new highs to be made first.
In prior historic analysis this was my alternate wave count. I am swapping what were my main and alternate monthly wave counts around because I consider this wave count to have a better look with better proportions.
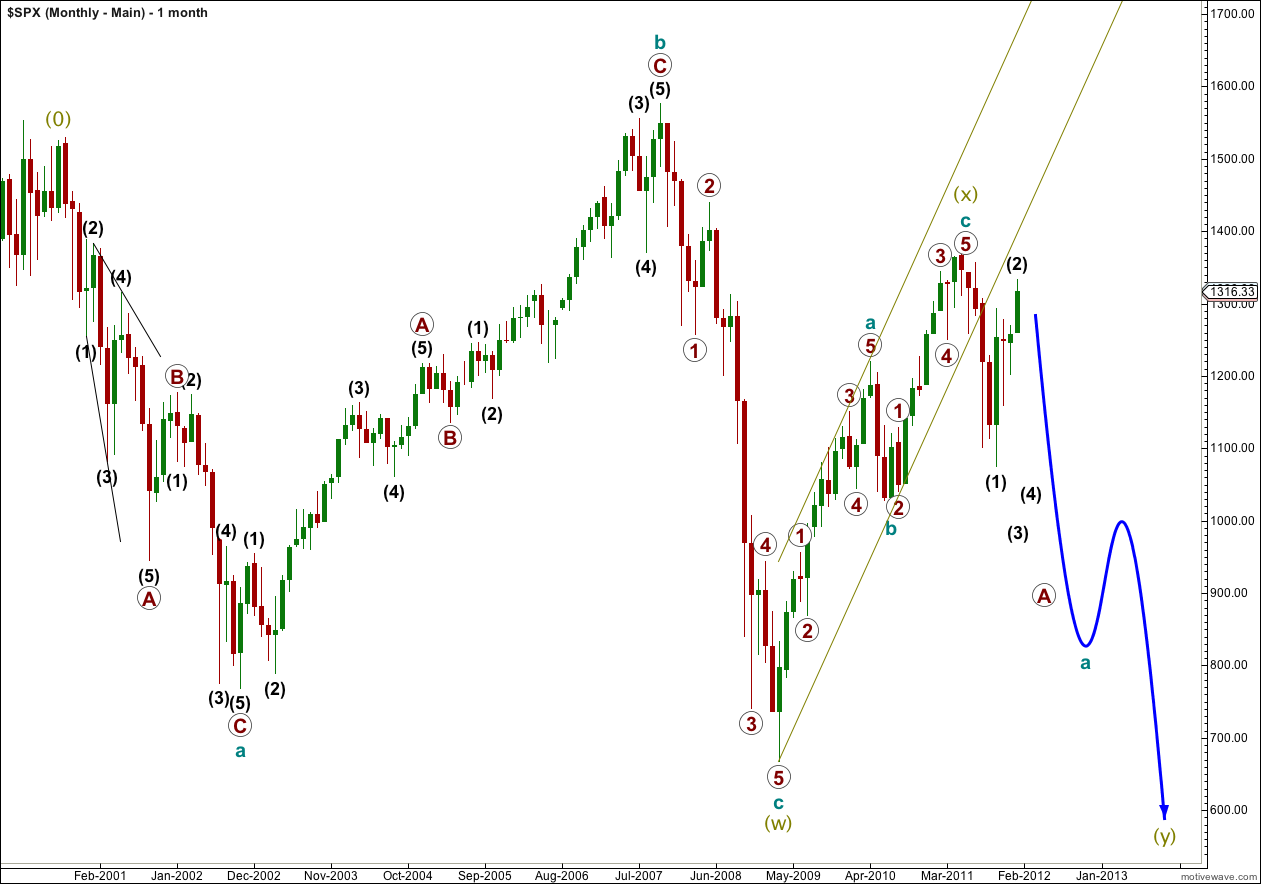
This wave count sees a grand super cycle correction unfolding which may be in a fourth wave position, or a second wave position. The key to determining which it could be involves analysing charts going back to the inception of this market. The S&P 500 index began in 1957, and it seems more likely that in its present form this very large correction would be a second wave correction. Second wave corrections may correct right down to the start of the first wave and it is possible that this correction could be very deep indeed. The correction begins at the supercycle (0) label.
This wave count sees this large correction unfolding as a double flat, or double combination. The first structure in the double is a super cycle flat correction labeled (w) olive green. The double is joined by a three (a zigzag) in the opposite direction labeled super cycle (x). The second structure labeled super cycle (y) may be either a flat (most likely), a zigzag (next likely) or a triangle (least likely). This second structure should take at least 10 years to unfold. Its purpose is to move price sideways and it does not technically have to make a new low below the end of super cycle (w), although it is fairly likely to. It should end around about the same level as (w).
Within cycle wave a (teal green) this may subdivide into a three wave structure (if super cycle (y) is a flat or triangle) or a five wave structure (if super cycle (y) is a zigzag). For both possibilities the next movement should be a third wave down.
This wave count fits subdivisions very well. It sees the upwards wave labeled super cycle (x) as a three, and this is most clearly a three on monthly and weekly charts. It sees the downwards movement labeled black (1) within primary wave A as a five, and on the daily and weekly charts this movement is most clearly a five.
The parallel channel drawn about super cycle wave (x) has been very clearly breached by downwards movement. The upwards three is over and a new trend downwards is underway.
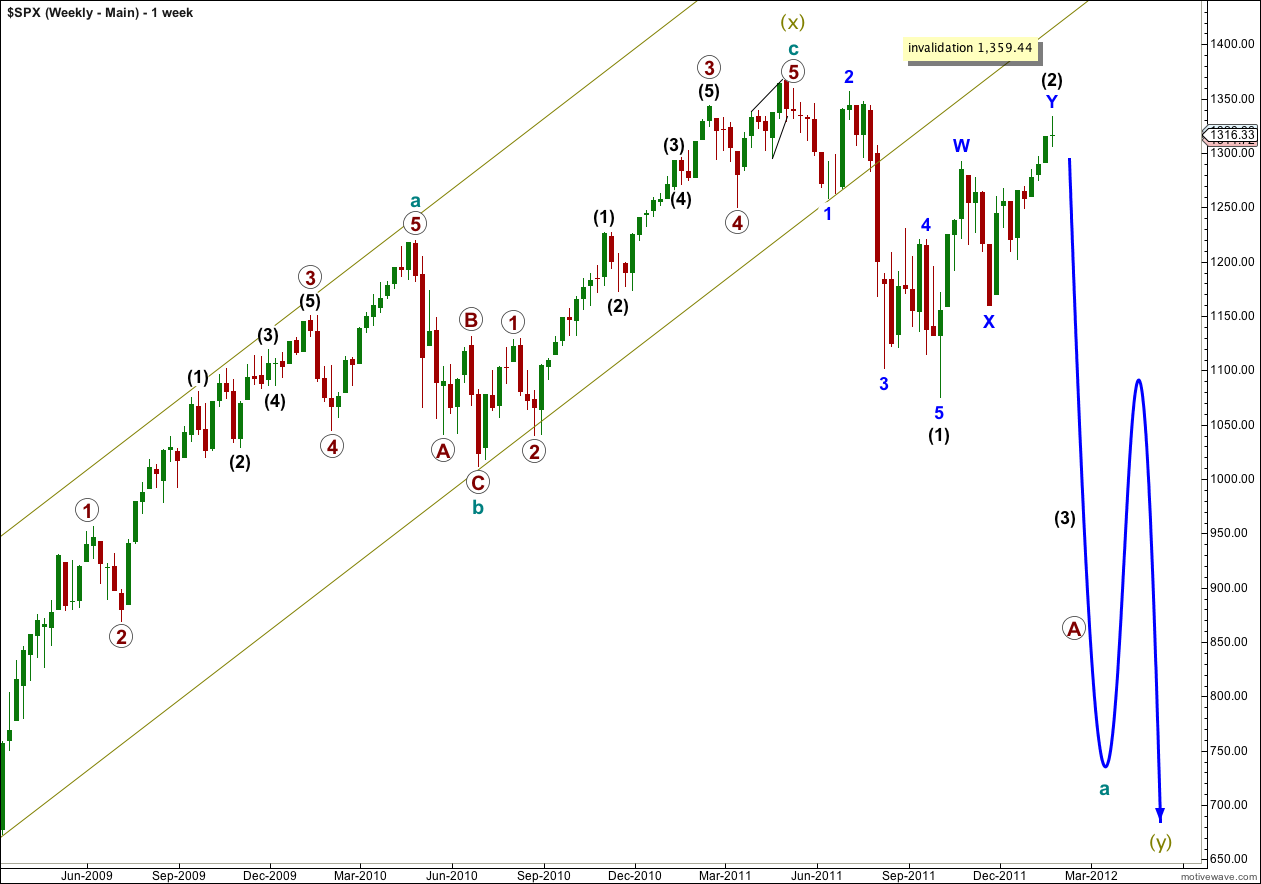
This weekly chart shows the structure of the end of super cycle wave (x) more clearly. This upwards movement subdivides neatly into a 5-3-5 zigzag. As soon as price breached the lower edge of the parallel channel containing this movement momentum to the downside increased.
Black wave (1) looks clearly like a five and subdivides neatly into five.
Corrections are reasonably well in proportion.
Alternate Historic Wave Count.
This wave count should be familiar to anyone who has followed Robert Prechter’s work with Elliott Wave International. This wave count sees the S&P 500 within an expanded flat correction at super cycle degree, and wave c at cycle degree is unfolding to the downside.
At 450.14 primary wave 3 will reach equality with primary wave 1.
Cycle wave c would reach 1.618 the length of cycle wave a at 127.53.
My problem with this wave count, and the reason why it is now my alternate wave count, is the size of primary wave 2. This long lasting correction seems out of proportion to cycle waves a and b. It gives the wave count a slightly odd look. However, it is a completely valid wave count and all the subdivisions fit well.
The next movement should be very strong to the downside. This wave count is extremely bearish.
Second Alternate Historic Wave Count.
This wave count is bullish in the long term but bearish in the mid term.
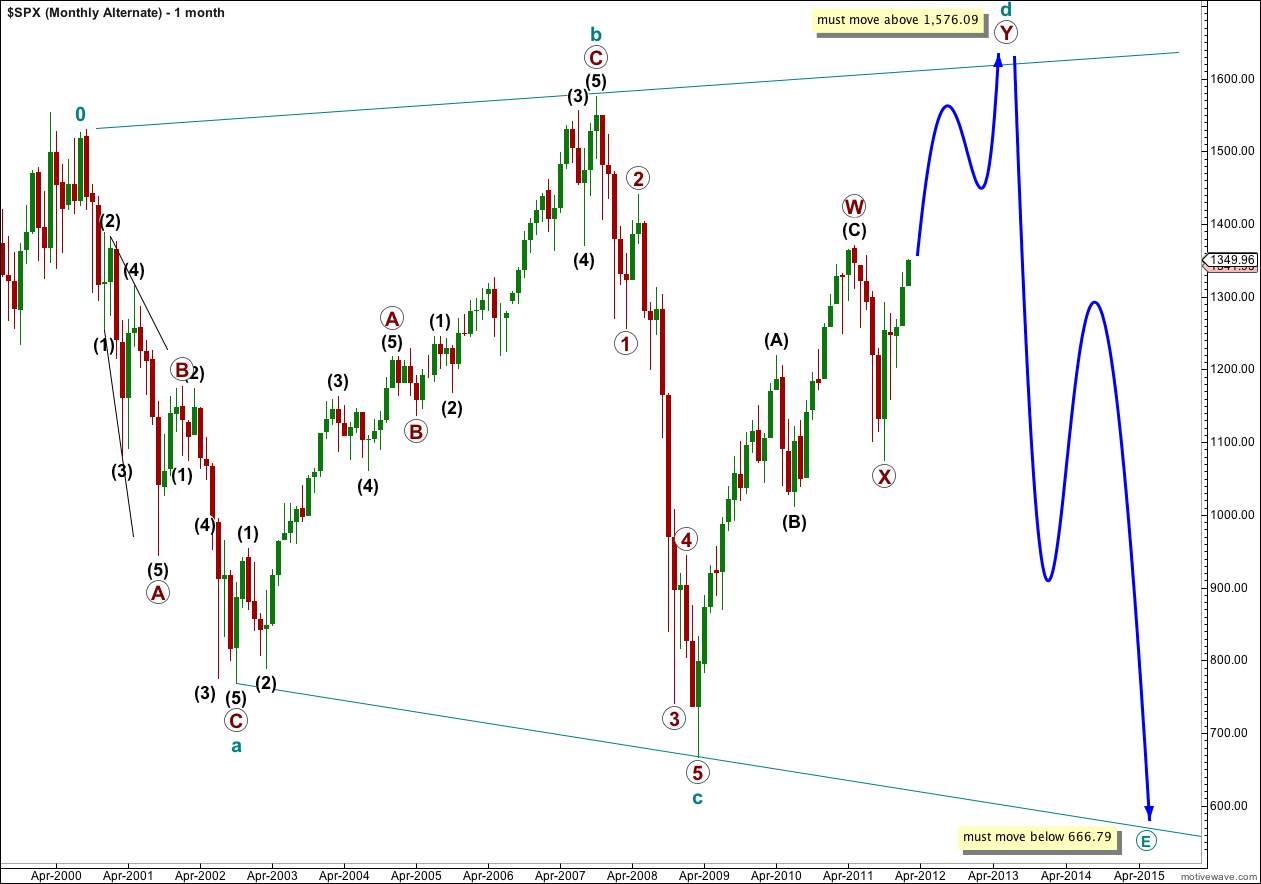
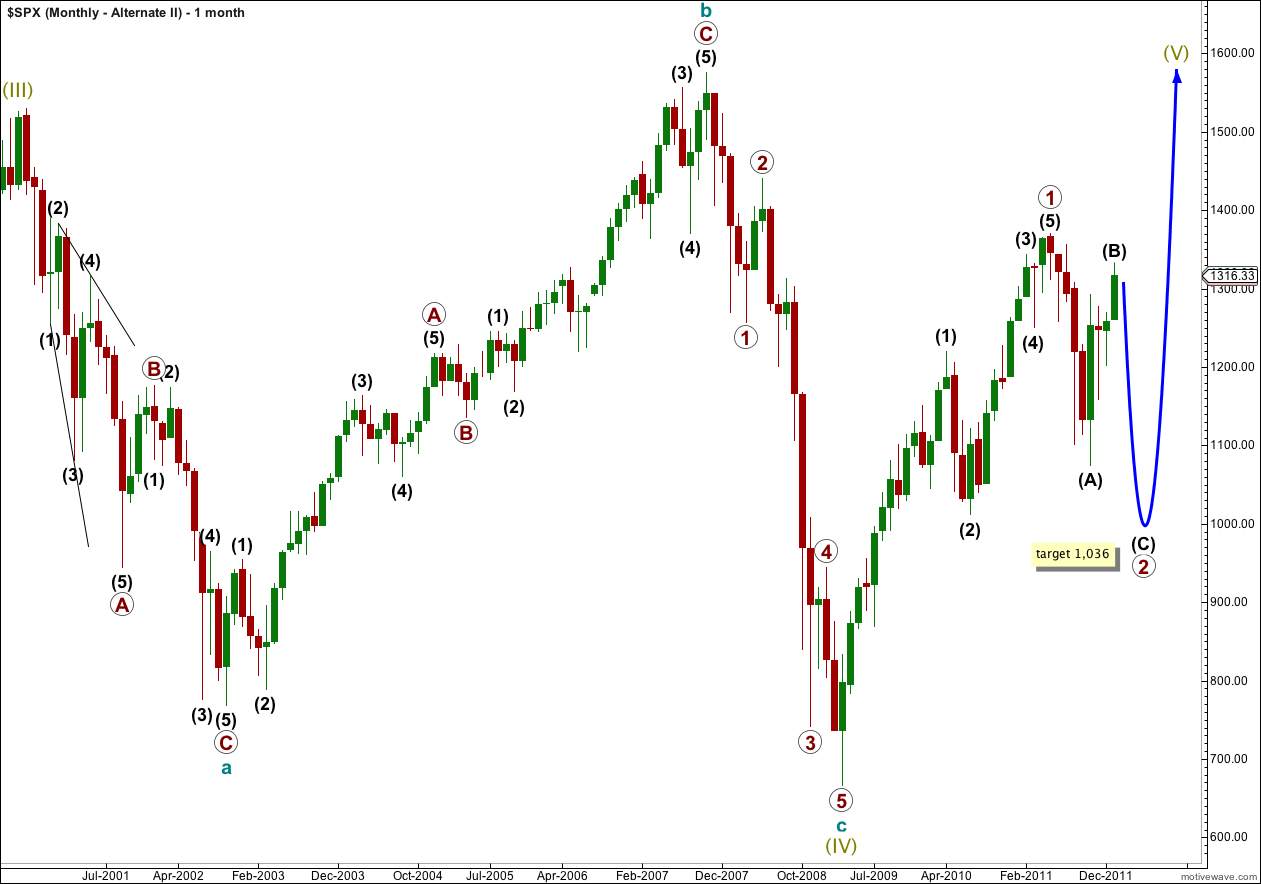
This wave count considers the possibility that the large flat correction labeled super cycle wave (iv) is the end of a correction and that following upwards movement is primary wave 1 of a new trend.
The biggest problem I have with this wave count is to see the upwards wave labeled primary 1 as a five when it has a strong three wave look to it.
At 1,036 intermediate wave (C) would reach equality with intermediate wave (A) within primary wave 2.
Primary wave 2 many not move beyond the start of primary wave 1. This wave count is invalidated with movement below 666.79.
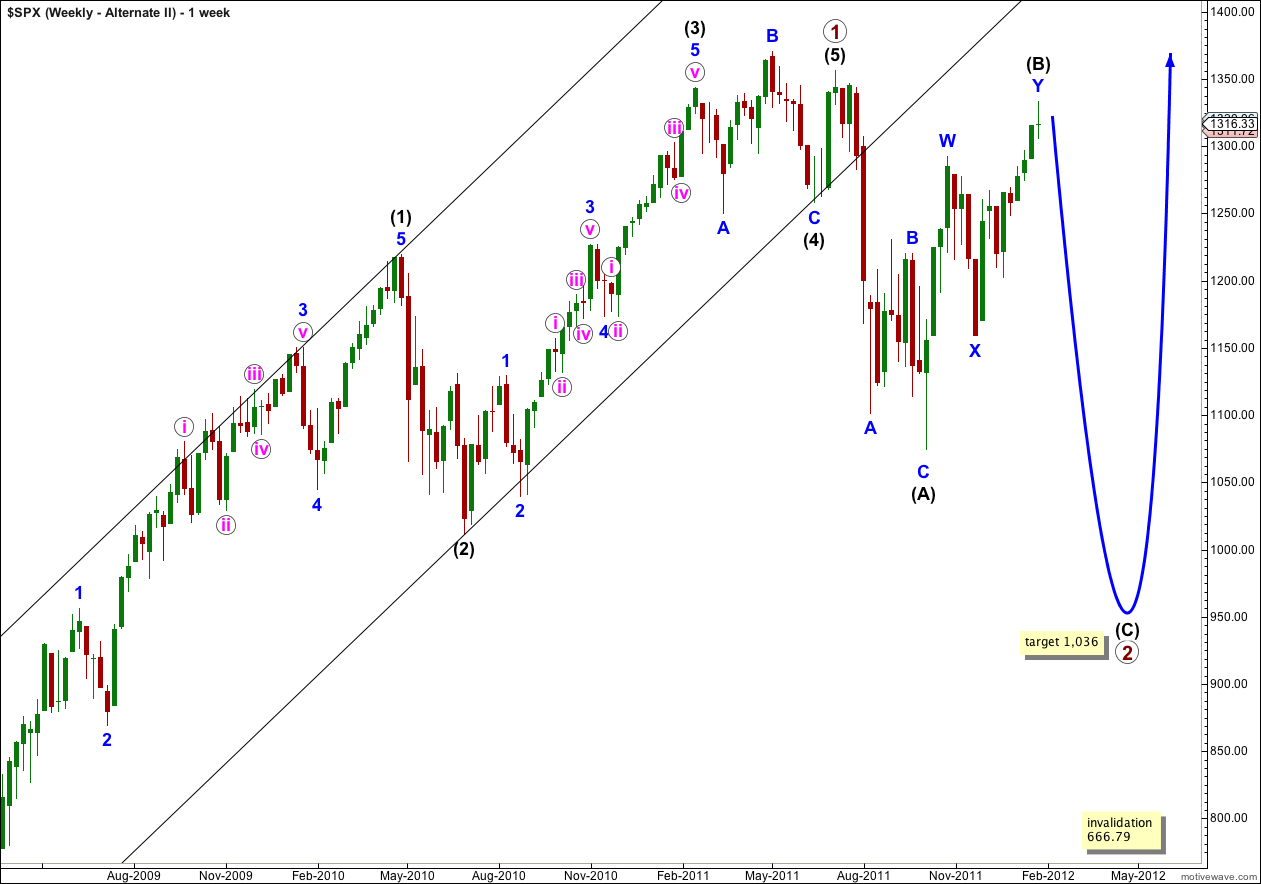
In order to see the upwards wave labeled primary wave 1 as a five and not a three the movement labeled (4) and (5) has to be incorporated into the end of the rise, and cannot be seen as part of the start of the downwards movement.
Wave (5) black to end primary wave 1 is not correctly termed a truncation, because it makes a new high beyond the end of black wave (3), but it does not move beyond the price extreme within black wave (4).
When this movement is part of primary wave 1 then the next movement down is a three and not a five. This means that primary wave 2 may be a flat correction which allows for wave (B) black to make a new high beyond the start of wave (A) black, and in fact it means this possibility has a reasonable probability because the most common flat is an expanded flat which requires (B) to be 105% of (A) or longer.
If our main daily wave count is invalidated by upwards movement then this is the wave count that we shall use.
My biggest concern with this wave count is seeing upwards movement labeled primary 1 as a five not a three.
Lara,
In your monthly count you say, “This second structure should take at least 10 years to unfold.:
Is that a misprint? If not, could you please elaborate and clarify. As a new subscriber I am playing catchup to learn where you are in your historical / long term count.
Thanks for your work. I’ve greatly enjoyed reading your daily commentary.
Rodney
Hi Rodney,
I said 10 years, when I really should have been clearer (and less lazy) and said about 7 – 10 years.
The first structure (w) olive green lasted nearly 9 years. So I’d expect the second structure in the double, labeled (y) olive green, to also last the same.
Cycle waves (teal green labels a-b-c) should last one to several years, supercycle waves should last multi decade. So this supercycle structure is very brief for a wave of that degree. The guidelines for duration of wave degrees that you find on the wave notation file are rough guidelines ONLY.
Lara, thank you for taking the time to entertain other possible scenarios. Its a healthy exercise. By doing this work we will get to a better solution and be prepared for what the market throws our way.
Cheers Michael. I have learned the hard way to always look for an alternate. I have been spectacularly wrong before, and if it happens again then I hope to be better prepared. I think that the best way to use EW analysis is to always look for as many alternates as you can find, to consider all possibilities, no matter how unlikely they seem.
As I’ve said before, the problem with very low probability wave counts is that although they have a low probability, they can still turn out to be correct.
I think the invalidation point for the Dow daily chart will hold, this has a high probability.