
The S&P 500 behaved mostly as expected during Wednesday’s session, moving first lower to 1.59 points below our short term target, before turning higher and ending up very close to where the market opened.
With the likely end of another fourth wave correction we may not calculate a target for the following fifth wave to end.
We should expect this upwards trend to continue to play out pretty much as expected. When the third and fourth waves within this final wave c pink upwards are complete then we will recalculate the target for this trend to end.
Click on the charts below to enlarge.
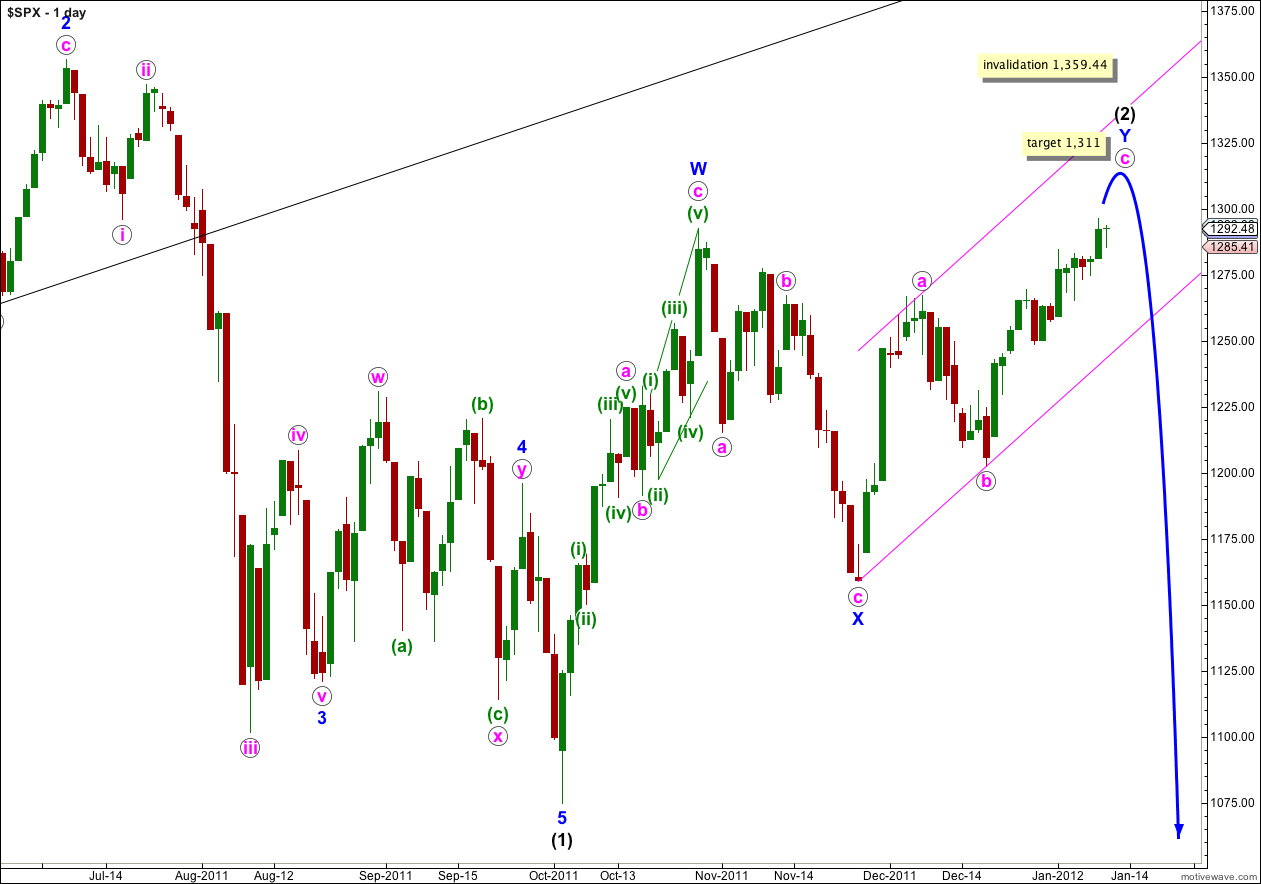
The structure for wave c pink still requires further upwards movement. At this stage our target will remain at 1,311 where wave c pink would reach equality in length with wave a pink. When waves (iii) and (iv) green within wave c pink are complete this target will be recalculated. The ratios within actionary waves of an impulse are more reliable in my experience than ratios between a and c waves of a correction.
Waves a and b pink both lasted a Fibonacci 8 days. Wave c pink has now lasted 15 days. The next Fibonacci number in the sequence is 21 which would see wave c pink end next Thursday the 19th of January, give or take a day either side of this date. However, Fibonacci time relationships are not as reliable as Fibonacci price ratios between waves so this date is a rough guide only.
When this parallel channel is breached by downwards movement then we shall have confirmation that wave Y blue zigzag is over and wave (3) black downwards should be underway.
Wave (2) black is a double zigzag, which is a relatively common structure. Triple zigzags are relatively rare structures, and when the second zigzag for wave Y blue is complete the probability that wave (2) is over will be very high.
Wave (2) black may not move beyond the start of wave (1) black. This wave count is invalidated with movement above 1,359.44.
Today we have to have two hourly wave counts. The small piece of downwards movement which ended during Wednesday’s session can be looked at in two ways.
Main Hourly Wave Count.
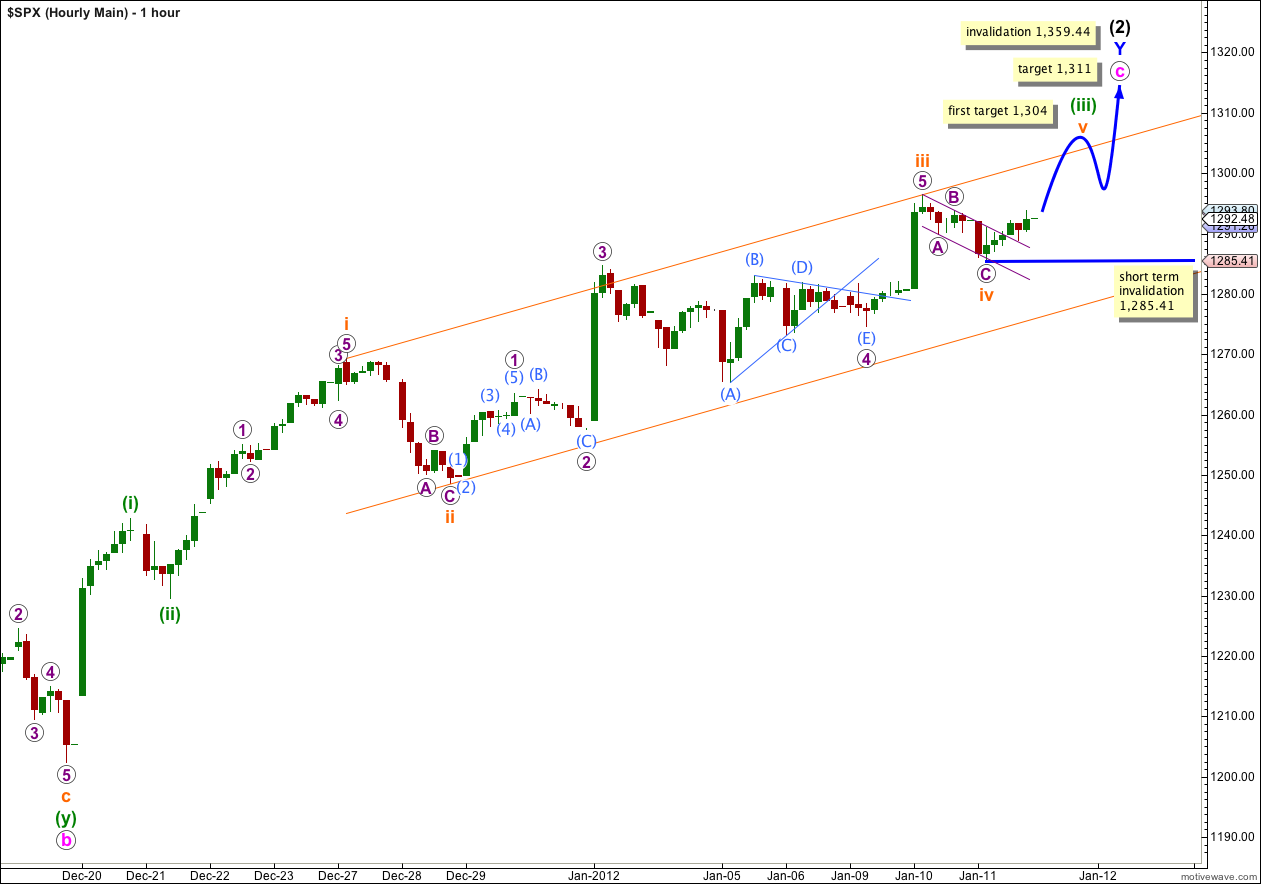
The small downwards zigzag which ended during Wednesday’s session may be wave iv orange in its entirety. There is no Fibonacci ratio between waves A and C purple within wave iv orange. The small channel about this zigzag is clearly breached by upwards movement.
The following upwards movement may be the start of wave v orange.
The first target for wave v orange to end may be about 1,304 where it would reach 0.382 the length of wave iii orange. This first target fits also with the target for wave c pink at 1,311. If price reaches this first target and keeps on rising then we shall use the second target. If price reaches the second target and keeps on rising then we shall use the third target.
If this first target is passed the next target may be about 1,315 where wave v orange would reach 0.618 the length of wave iii orange. The third target would be at 1,325 where wave v orange would reach equality in length with wave i orange. These second and third targets require a new calculation for wave c pink to end.
If wave iv orange is complete then within wave v orange no second wave correction may move beyond the start of the first wave.
If price moves below 1,285.41 tomorrow then we should use the alternate hourly wave count below.
Alternate Hourly Wave Count.
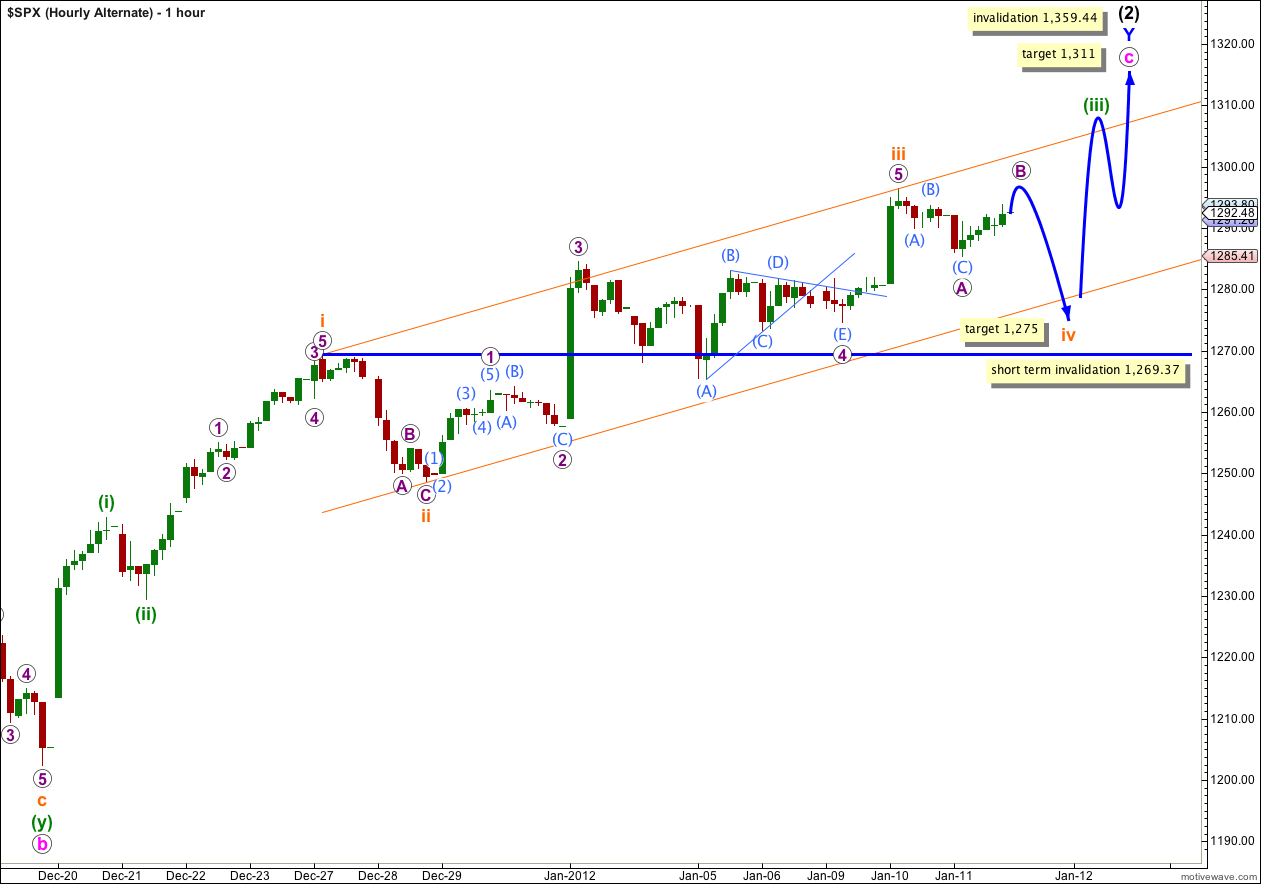
If we move the degree of labeling within wave iv orange down one degree then we may have only seen wave A purple within wave iv orange completed today.
Wave iv orange may be continuing sideways as a flat or triangle. For both of these structures wave B may move beyond the start of wave A, and unfortunately there is no upwards price point which would invalidate this alternate and confirm the main wave count. The only thing which would do that at this stage is seeing a clear five wave structure upwards on the five minute chart. So far upwards movement is not a clear five.
If price moves higher tomorrow and upwards movement looks more like a three wave structure, then it turns back down, draw a parallel channel about wave iv orange. Draw the channel from the start of wave A purple to the end of wave B purple, then place a parallel copy on the low of A purple. Expect wave C purple to end wave iv orange about the lower end of that channel, or to overshoot that lower line. When that small channel is breached by upwards movement then wave iv orange would likely be over.
If wave iv orange is not over and continues further sideways and lower it may end about the fourth wave of one lesser degree at 1,275. It may find resistance about the lower edge of the parallel channel, it may slightly overshoot the channel. If it overshoots the channel then the following fifth wave for v orange may also overshoot the channel on the opposite side.
Wave iv orange may not move into wave i orange price territory. This wave count is invalidated with movement below 1,269.37.
Lara, thanks for the targets, they are very helpful.
You’re welcome! In this instance, I thought that more might be better 🙂