
As expected the S&P 500 moved higher passing straight through our target for this session, and reaching up to our next target which we did not expect to be reached until later this week or early next week.
The structure unfolding still requires further movement. Our final target may still be reached next week.
Click on the charts below to enlarge.
Movement above 1,283.05 in the first 5 minutes of Tuesday’s session added confidence that the fourth wave triangle was over and a fifth wave upwards should be underway.
Our target for Tuesday’s session was 1,289 and this was quickly passed.
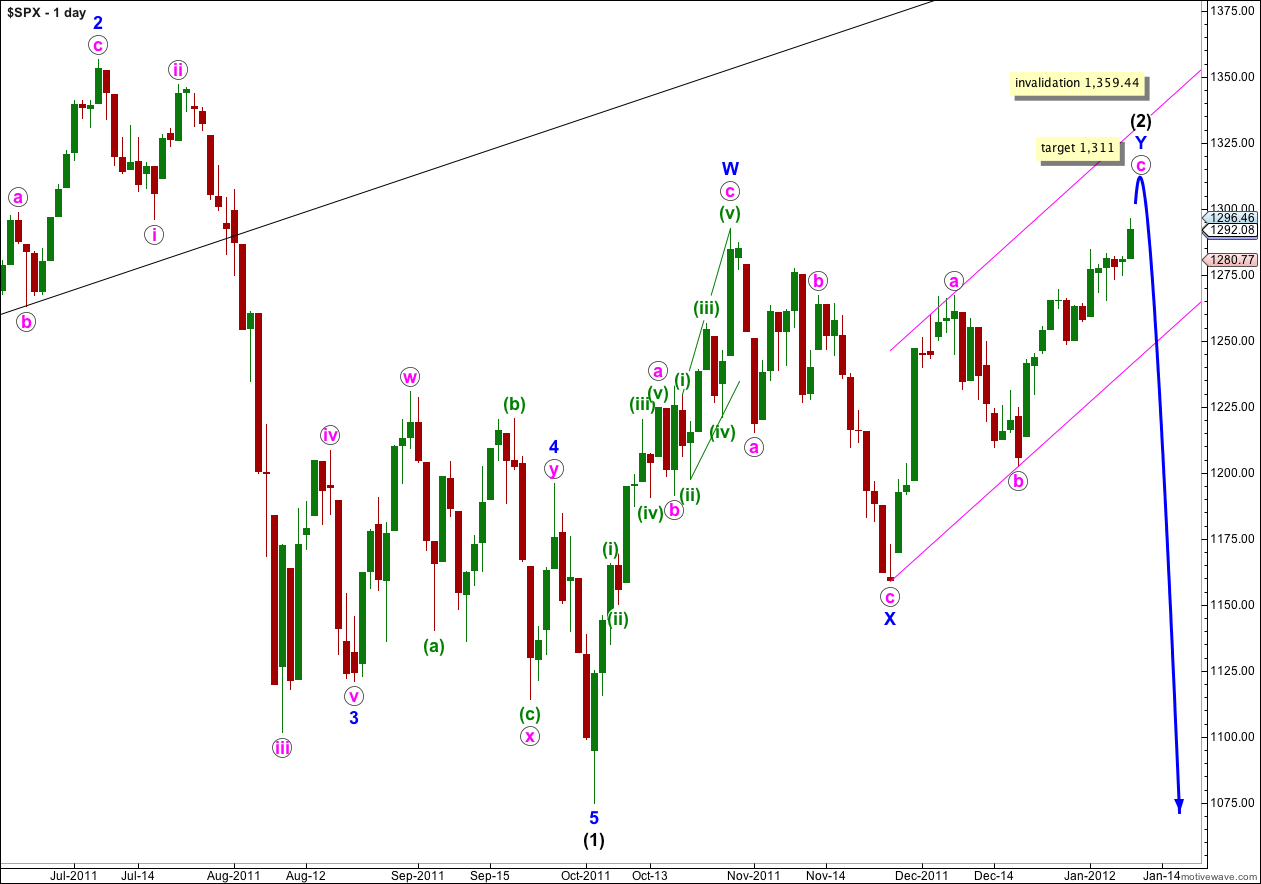
The structure for wave c pink still requires further upwards movement. Wave c pink may end either mid way in the channel, or about the upper edge. At 1,311 wave c pink would reach equality with wave a pink.
Wave Y blue has now reached slightly above the high labeled W blue at 1,292.66. The purpose of this double zigzag is to deepen the correction, and this purpose is now achieved.
Waves a and b pink both lasted a Fibonacci 8 days. Wave c pink has so far lasted 14 days. The next Fibonacci number in the sequence is 21 and so it may end next Thursday 19th January, give or take a day either side. However, this is a rough guide only because Fibonacci time relationships are not always very reliable. Price is a more reliable guide than time.
When this parallel channel is breached by downwards movement then we shall have confirmation that wave Y blue zigzag is over and wave (3) black downwards should be underway.
Wave (2) black is a double zigzag, which is a relatively common structure. Triple zigzags are relatively rare structures, and when the second zigzag for wave Y blue is complete the probability that wave (2) is over will be very high.
Wave (2) black may not move beyond the start of wave (1) black. This wave count is invalidated with movement above 1,359.44.
We have now only one hourly wave count for the S&P 500 which agrees with the Dow. Upwards movement above 1,288.50 invalidated the alternate hourly wave count.
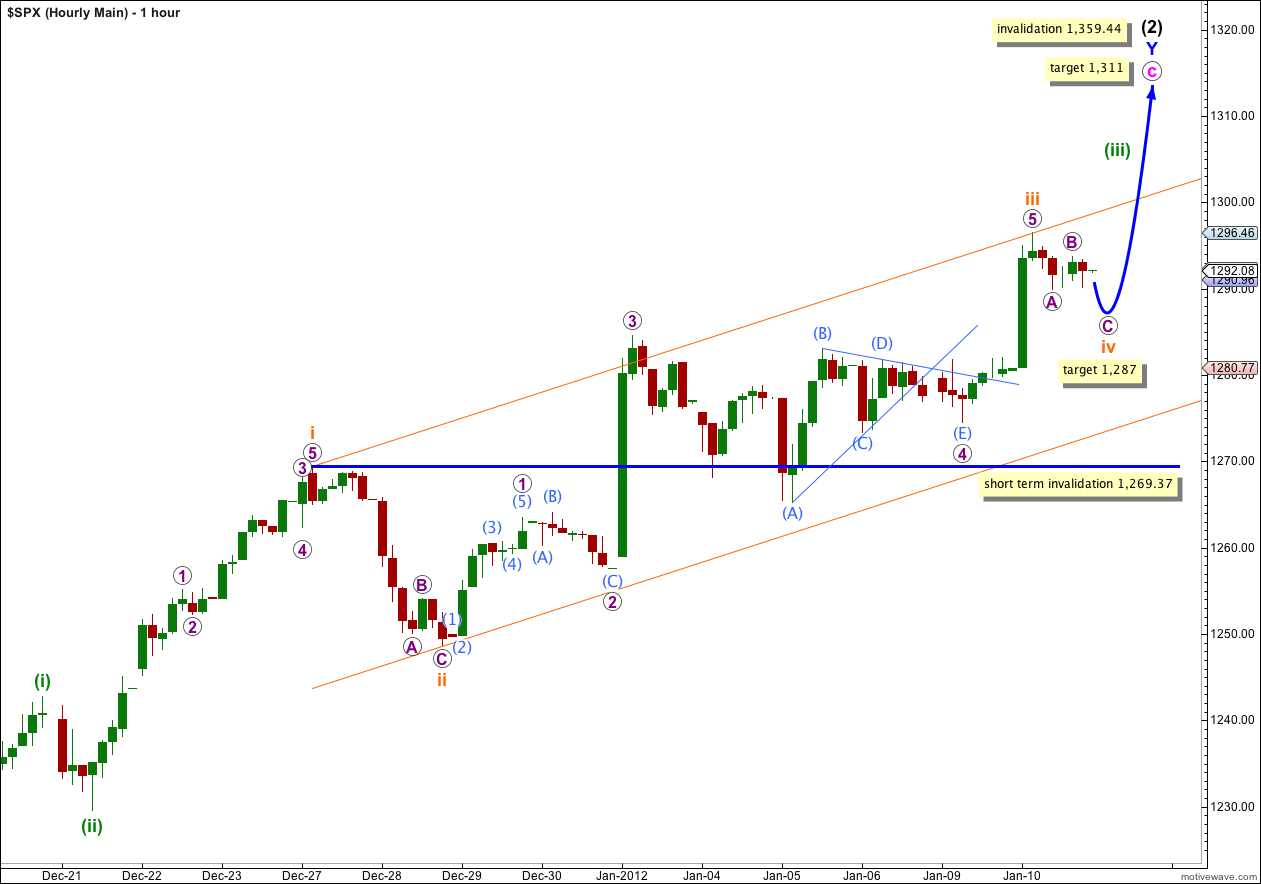
Movement above 1,288.50 has confirmed that wave (iii) green must be extending.
Within wave (iii) green wave iii orange is now a complete five wave impulse. Wave iii orange has no Fibonacci ratio to wave i orange and it is highly likely that wave v orange will exhibit a Fibonacci ratio to either of i or iii orange. The most likely ratio for wave v orange is equality with wave i orange at 40 points in length. The second likely wave length for v orange is 30 points in length, 0.618 the length of wave iii orange.
Unfortunately, wave iv orange is most likely incomplete at the end of Tuesday’s session. It should move a little lower. At 1,287 wave C purple would reach equality with wave A purple.
When wave iv orange is a complete three wave structure then we should expect further upwards movement for wave v orange to be either 30 or (more likely) 40 points in length. This will end wave (iii) green, which may not have a Fibonacci ratio to wave (i) green.
Wave iv orange may end during tomorrow’s session, or it may yet take another one to few days to complete. I would not expect it to be as time consuming as wave 4 purple was though.
We may now use Elliott’s channeling technique to redraw the parallel channel about wave (iii) green. Draw the first trend line from the highs labeled i and iii orange, then place a parallel copy on the low labeled ii orange. Wave iv orange may end mid way within this channel, or about the lower edge where it should find resistance.
If wave iv orange remains within the channel then wave v orange should end either mid way or at the upper edge of the channel.
If wave iv orange overshoots the channel then we will redraw it using Elliott’s second technique.
Wave iv orange may not move into wave i orange price territory. This wave count is invalidated with movement below 1,269.37.
When wave (iii) green is complete we will move the invalidation point down to the high of wave (i) green at 1,242.82.
You mention that “When wave iv orange is a complete three wave structure then we should expect further upwards movement for wave v orange to be either 30 or (more likely) 40 points in length.”
Would that mean wave v orange would be either 1287+30=1317 or 1287+40=1327? It exceed 1311 target.
Yes.
The target of 1,311 will probably change. When there is more to analyse, specifically when (iii) and (iv) green are complete then I can recalculate the target using more than one wave degree to try and get a higher probability target.
The expected length of v orange as either 40 or 30 points would take price to 1,317 or 1,327 at this stage. However, it does not have to be one of these two lengths, another Fibonacci ratio not considered may come into play, or no ratio at all.
Edit: another possibility is that v orange could be 0.382 the length of iii orange, ending at 1,304