
We had expected the S&P 500 to move higher during last week and it has. Sideways movement is probably a time consuming fourth wave triangle.
Our target for upwards movement to end may finally be reached next week. We should continue to use the parallel channels on our hourly and daily charts to indicate where upwards movement may find resistance, and to indicate a trend change when the channels are breached.
Click on the charts below to enlarge.
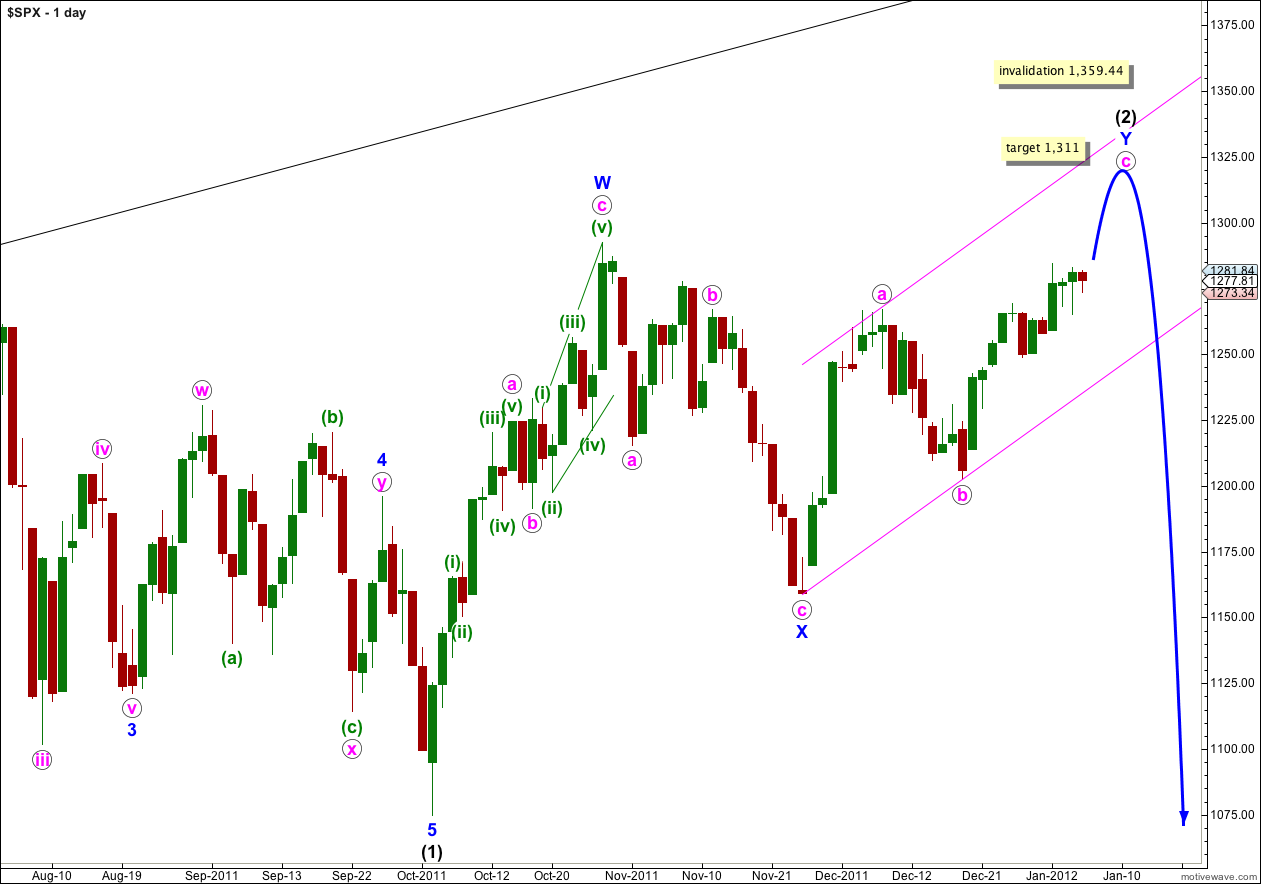
The structure of wave c pink on the hourly chart requires further upwards movement still before it can be considered complete. Wave c pink may end either mid way in the channel, or about the upper edge.
At 1,311 wave c pink would reach equality with wave a pink.
When this parallel channel is breached by downwards movement then we shall have confirmation that wave Y blue zigzag is over and wave (3) black downwards should be underway.
Wave (2) black is a double zigzag, which is a relatively common structure. Triple zigzags are relatively rare structures, and when the second zigzag for wave Y blue is complete the probability that wave (2) is over will be very high.
Wave (2) black may not move beyond the start of wave (1) black. This wave count is invalidated with movement above 1,359.44.
This wave count has a much higher probability than the hourly alternate. It has a more typical pattern. The alternate is invalidated now for the Dow, and I would expect the Dow and S&P 500 to move together at this stage.
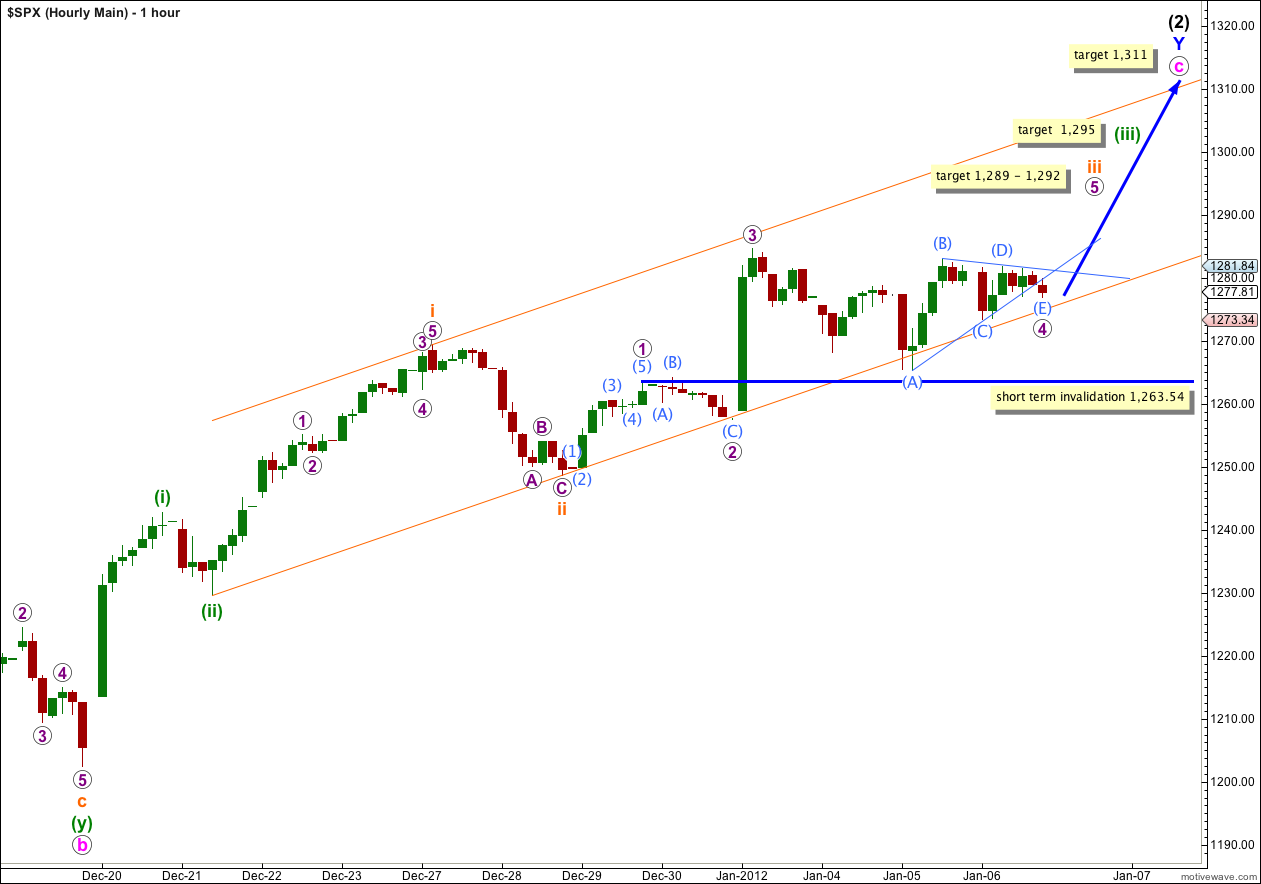
Sideways movement for last week looks at this stage like a fourth wave triangle. The triangle will remain valid if price does not move below the low labeled (C) aqua at 1,273.34. When price moves above the high labeled (D) aqua at 1,281.84 then the triangle may be over and wave 5 purple may be underway.
This wave count expects that wave (iii) green within wave c pink is extending, and within wave (iii) green wave iii orange is also extending. Third waves are commonly extended.
At 1,292 wave 5 purple would reach equality with wave 1 purple, the most common relationship between first and fifth waves. At 1,289 wave iii orange would reach equality with wave i orange. This gives us a small three point target zone which should be reached early next week, possibly Monday or Tuesday.
Thereafter, wave iv orange should take at least one session and it should move price mostly sideways and not below 1,269.37.
At 1,295 wave (iii) green would reach 1.618 the length of wave (i) green. This target should now be reached next week.
Thereafter, another fourth wave correction should develop which may take price significantly lower. It may be a deep correction but it may not move below 1,242.82.
A final fifth wave may end about 1,311. If wave c pink lasts a Fibonacci 21 days it may end January 19th, but this is a rough guideline only because wave c pink may not have a Fibonacci time relationship at all.
Alternate Hourly Wave Count.
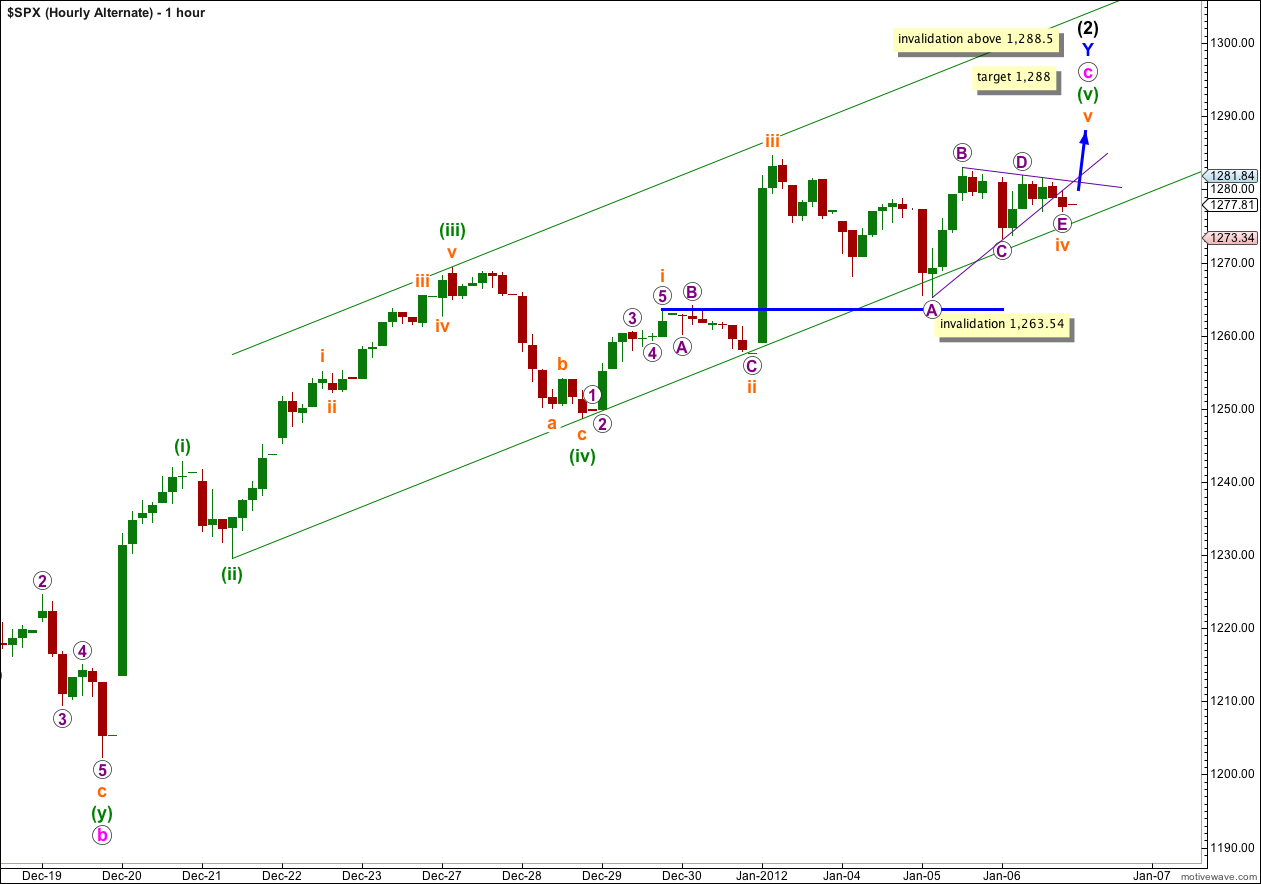
This wave count remains valid for the S&P 500 but not the Dow after last week’s new high. Therefore, the probability for this wave count for the S&P 500 is significantly reduced.
For that reason I really do not want to consider it at this stage seriously. Only if it shows itself to be correct should we spend time on it.
Hi Lara!
Could you speak up a little bit?
The sound is too soft.
Thank-You
Sure, will do.
hi lara thanks for the update. I would appreciate it if you had the time to update your views on gold. thanks and happy new year. LJ
I’ll probably find time to do just charts without too much text and no video for gold this week.