
Elliott Wave chart analysis for the S&P 500 for 27th December, 2011. Please click on the charts below to enlarge.
The S&P 500 has moved slightly higher, above 1,267.06 to confirm our primary wave count.
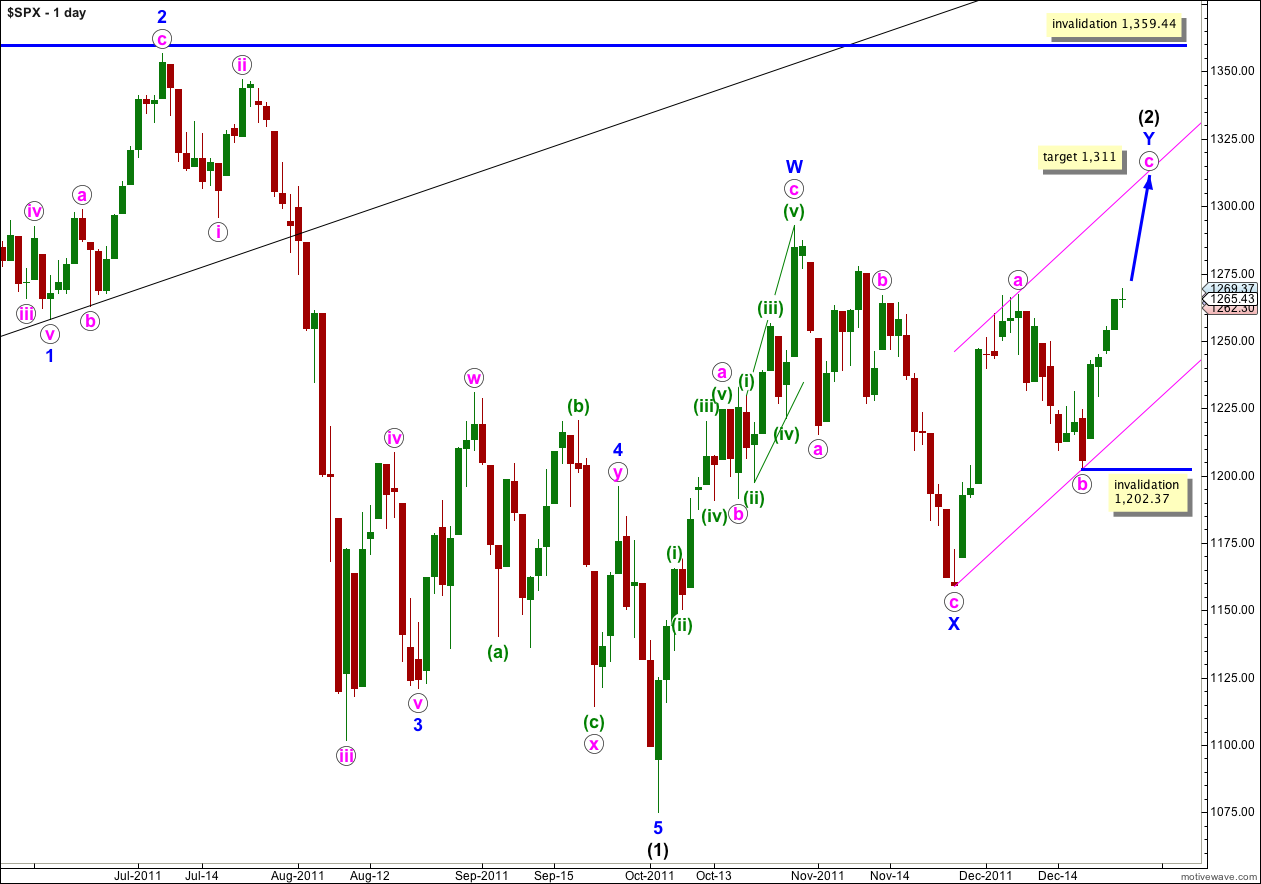
Wave c pink has moved price beyond the end of wave a pink avoiding a truncation.
Wave (2) black is a double zigzag structure. The purpose of a double zigzag is to deepen a correction and it is very likely that wave Y blue will take price above the high of wave W blue at 1,292.66.
Waves a and b pink both lasted a Fibonacci 8 days. If wave c pink continues this pattern it will continue higher for another three trading sessions, ending on Friday 30th December.
At 1,311 wave c pink would reach equality with wave a pink.
Within wave c pink no second wave correction may move beyond the start of the first wave. This wave count is invalidated with movement below 1,202.37.
Wave (2) black may not move beyond the start of wave (1) black. This wave count is invalidated with movement above 1,359.44.
We may use Elliott’s channeling technique to draw a parallel channel about the zigzag of wave Y blue. Wave c pink may end about the upper edge of this parallel channel.
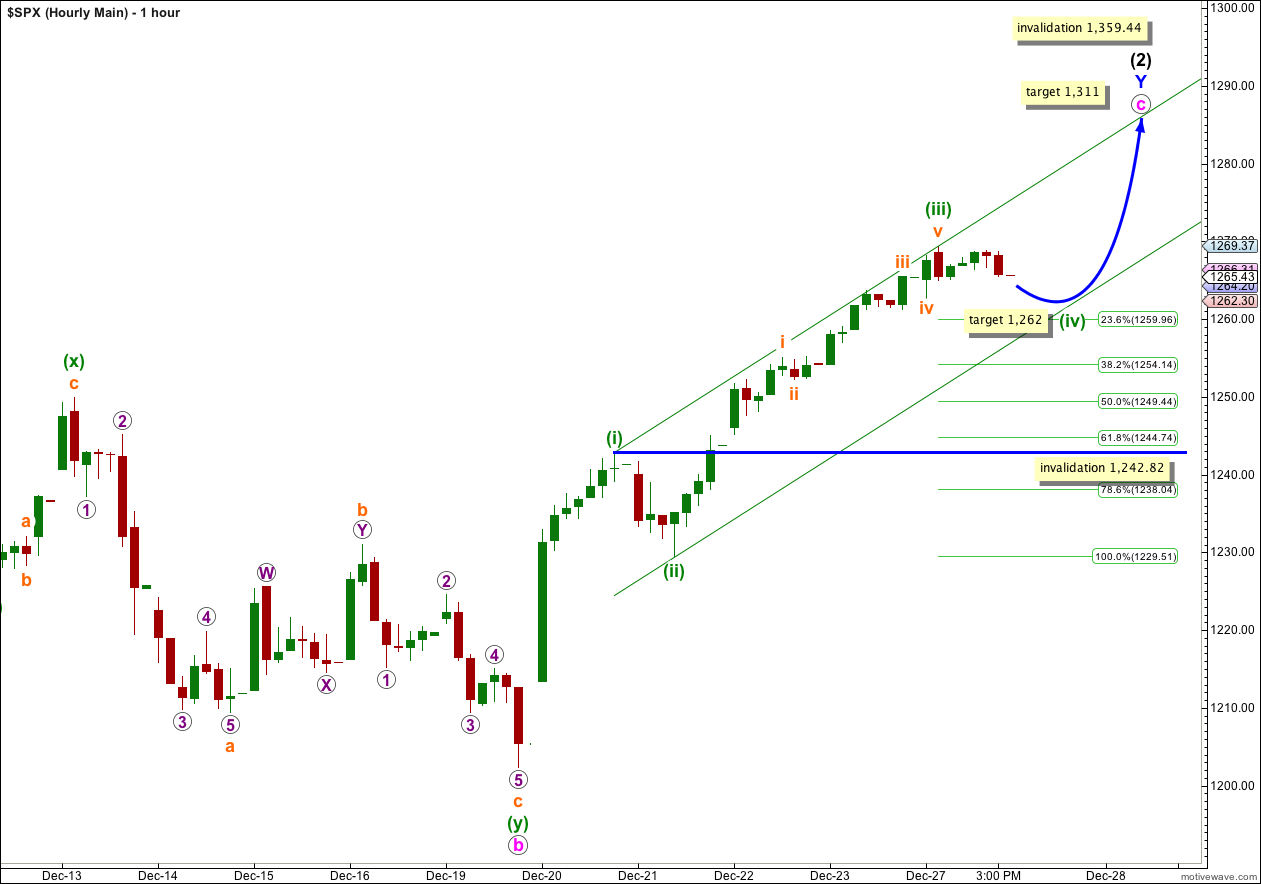
Wave iv orange moved lower to begin the session as expected, ending at 1,262.30 just above our very short term target of 1,261.
Thereafter price continued higher as expected.
Wave (iii) green may be over already, falling well short of our target at 1,295. If this is correct there are no adequate Fibonacci ratios between orange waves i, iii and v within wave (iii) green.
We may redraw the parallel channel about the impulse for wave c pink upwards using Elliott’s channeling technique. Draw the first trend line from the highs of (i) to (iii) green, and place a parallel copy on the low of wave (ii) green. Wave (iv) green may find support at the lower trend line, and the following final wave (v) green upwards may find resistance at the upper trend line.
Edit: Wave (iii) green was 0.59 points shorter than equality with wave (i) green. This means wave (v) green is limited to no longer than equality with wave (iii) green which was 39.86 points in length. I cannot give a maximum limit for wave (v) green until we know where wave (iv) green has ended.
Wave (ii) green was a very shallow zigzag structure. We would expect wave (iv) green to be a flat, triangle or combination correction. We would also expect wave (iv) green to be a deep correction, but this may not be the case as flats and triangles are normally shallow structures.
Wave (iv) green may end about the fourth wave of one lesser degree. Wave iv orange has it’s end at 1,262.30. Wave (iv) green may end with a small overshoot of the 0.236 Fibonacci ratio about 1,262.
Wave (iv) green may not move into wave (i) green price territory. This wave count is invalidated with movement below 1,242.82.
Price movement above 1,267.06 has invalidated what was our first alternate wave count from last analysis. We have only one alternate wave count left.
Alternate Wave Count.
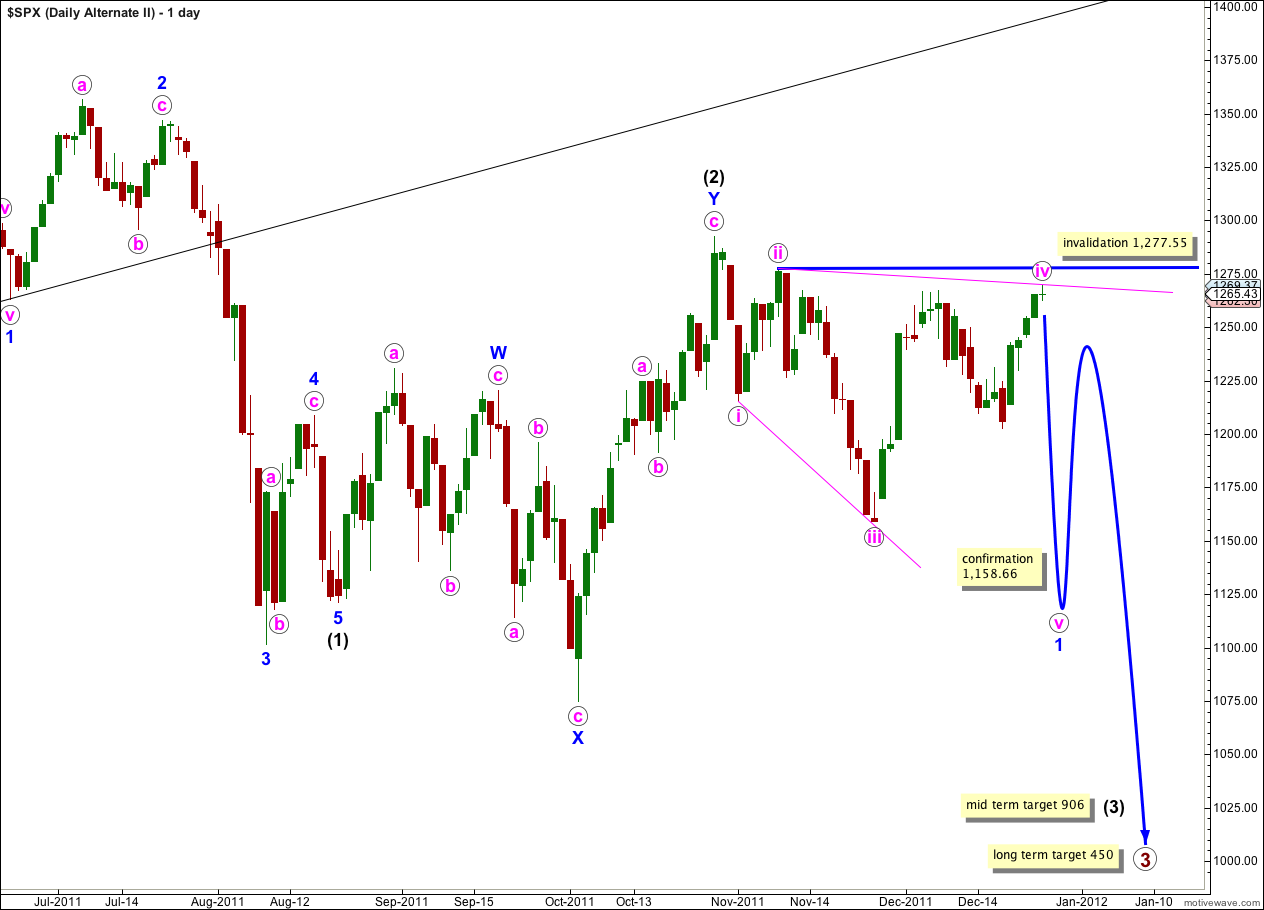
There are three reasons why I consider this wave count to have a very low probability:
1. Wave iv pink is already deeper than 0.81 of wave iii pink; this is the maximum common length for wave 4 within a diagonal in relation to wave 3.
2. While leading diagonals are not uncommon, leading expanding diagonals are supposedly less common structures.
3. A similar wave count on the Dow is invalidated; the Dow and S&P 500 have been moving together nicely for some time and it would be highly unusual for them to now diverge.
Within the leading diagonal for wave 1 blue wave iv pink may not move beyond the end of wave ii pink. This wave count is invalidated with movement above 1,277.55.
A leading diagonal may not have a truncated fifth wave. This wave count requires movement below 1,158.66 to remain valid.
Lara,
If wave iii green is over, was it shorter than wave i green, and if so, can you provide a maximum for wave v green? Thanks.
Peter
Hi Peter, I have updated the text article with another sentence to cover this. I cannot provide a maximum price point for wave (v) green until we know where wave (iv) green has ended.