
Elliott Wave chart analysis for the S&P 500 for 23rd December, 2011. Please click on the charts below to enlarge.
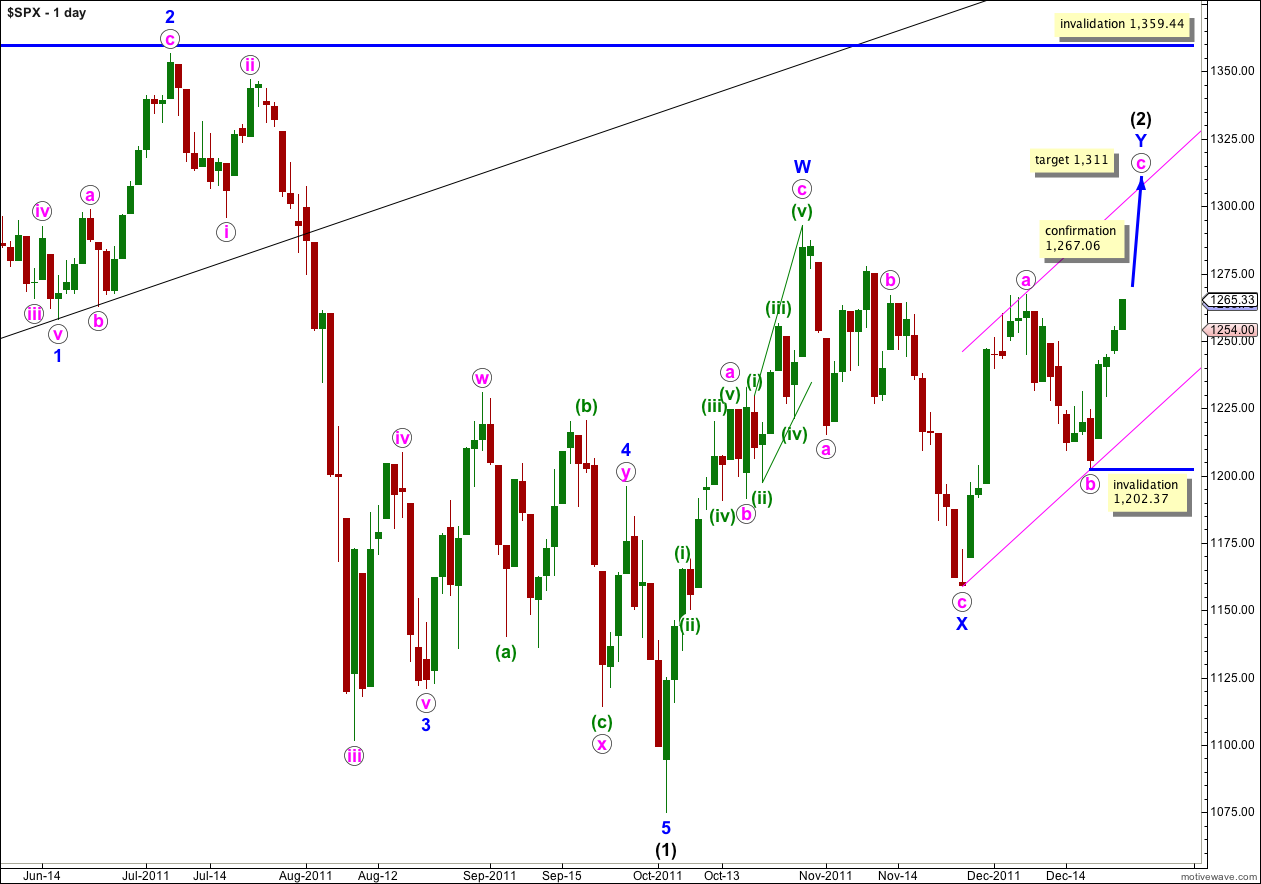
As expected the S&P 500 has moved higher again. Price is now just below our confirmation point at 1,267.06. Upwards movement has so far lasted 4 days, halfway to our target.
Wave c pink is highly likely to take price to a new high above the end of wave a pink at 1,267.06 to avoid a truncation. Wave Y blue is highly likely to take price to a new high above the end of wave W blue at 1,292.66 to achieve the purpose of a double zigzag, which is to deepen a correction.
At 1,311 wave c pink would reach equality in length with wave a pink. This is the most likely target for upwards movement to end.
We may draw a parallel channel about the zigzag for wave Y blue. Wave c pink may end about the upper edge of the channel, or with a small overshoot.
Waves a and b pink both lasted a Fibonacci 8 days. If wave c pink continues this pattern and also lasts a Fibonacci 8 days it would end on Friday 30th December.
Movement above 1,267.06 would confirm this wave count at intermediate (black) degree because at the point our first alternate wave count would be invalidated.
Within wave c pink no second wave correction may move beyond the start of its first wave. This wave count is invalidated with movement below 1,202.37.
Wave (2) black may not move beyond the start of wave (1) black. This wave count is invalidated with movement above 1,359.44.
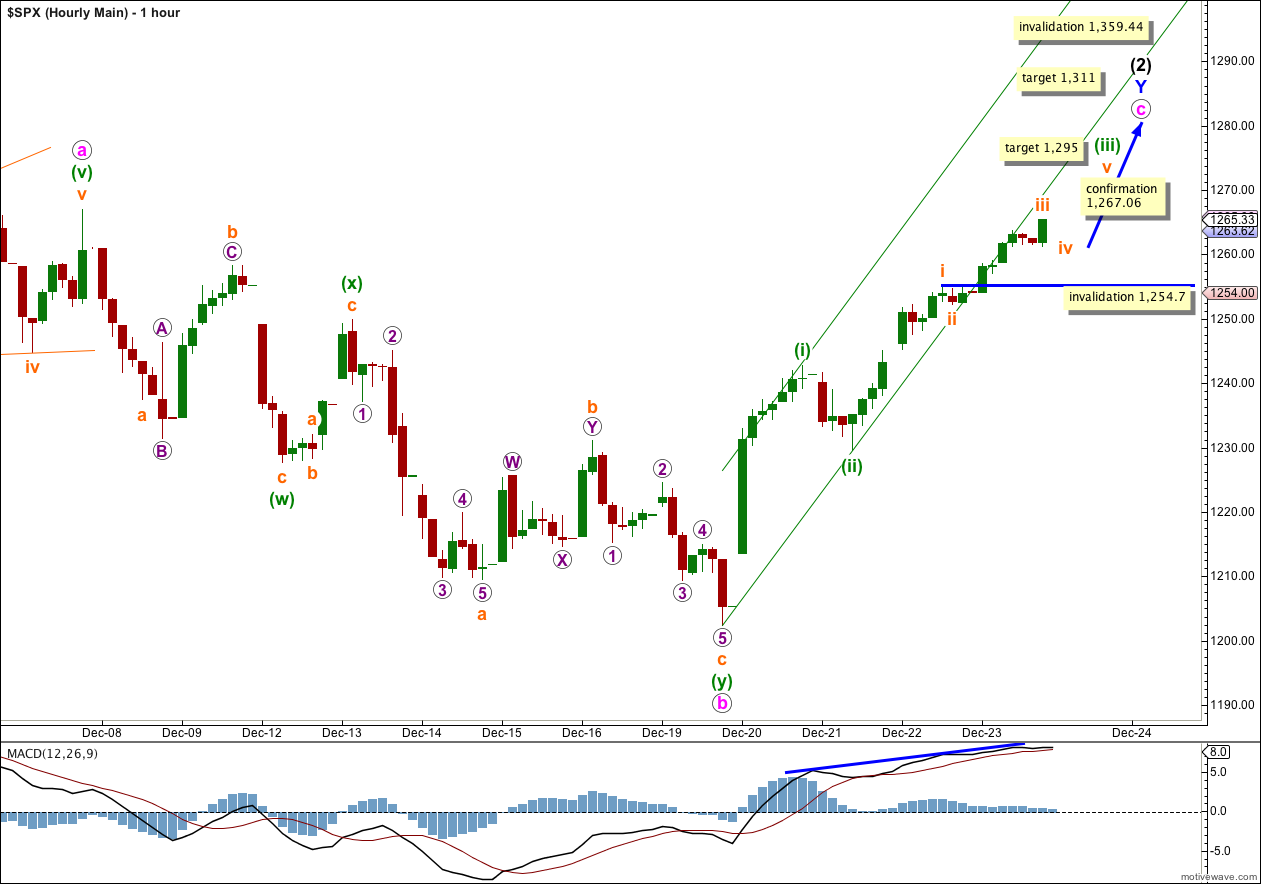
Upwards movement continues as expected. At this stage it looks most likely that wave (iii) green is not yet complete, and the strongest part of upwards movement may have unfolded during Friday’s session.
The base channel drawn here on the hourly chart does not seem to be working as expected. I had expected wave iii orange within wave (iii) green to take price above the upper edge of this channel. This is a tendency of third waves and it is not a requirement for this wave count.
When wave (iii) green is complete we should redraw the channel. Draw the first trend line from the high of (i) green to the high of wave (iii) green, then place a parallel copy on the low of wave (ii) green. This parallel channel may show us where wave (iv) green finds support at the lower edge, and where wave (v) green finds resistance at the upper edge.
If this analysis of the middle of wave (iii) green is correct then wave iv orange downwards may not move into wave i orange price territory. This wave count (at least the analysis of wave (iii) green) is invalidated with movement below 1,254.7.
At this stage there is no divergence with price trending higher MACD is also trending higher. This is what we would expect to see for a third wave unfolding, and MACD supports this wave count.
At 1,295 wave (iii) green would reach 1.618 the length of wave (i) green.
When wave (iii) green is complete the invalidation point must move down to the high of wave (i) green at 1,242.82. This may happen within the next trading session.
At 1,311 wave c pink would reach equality in length with wave a pink. This target may be reached on Friday 30th December.
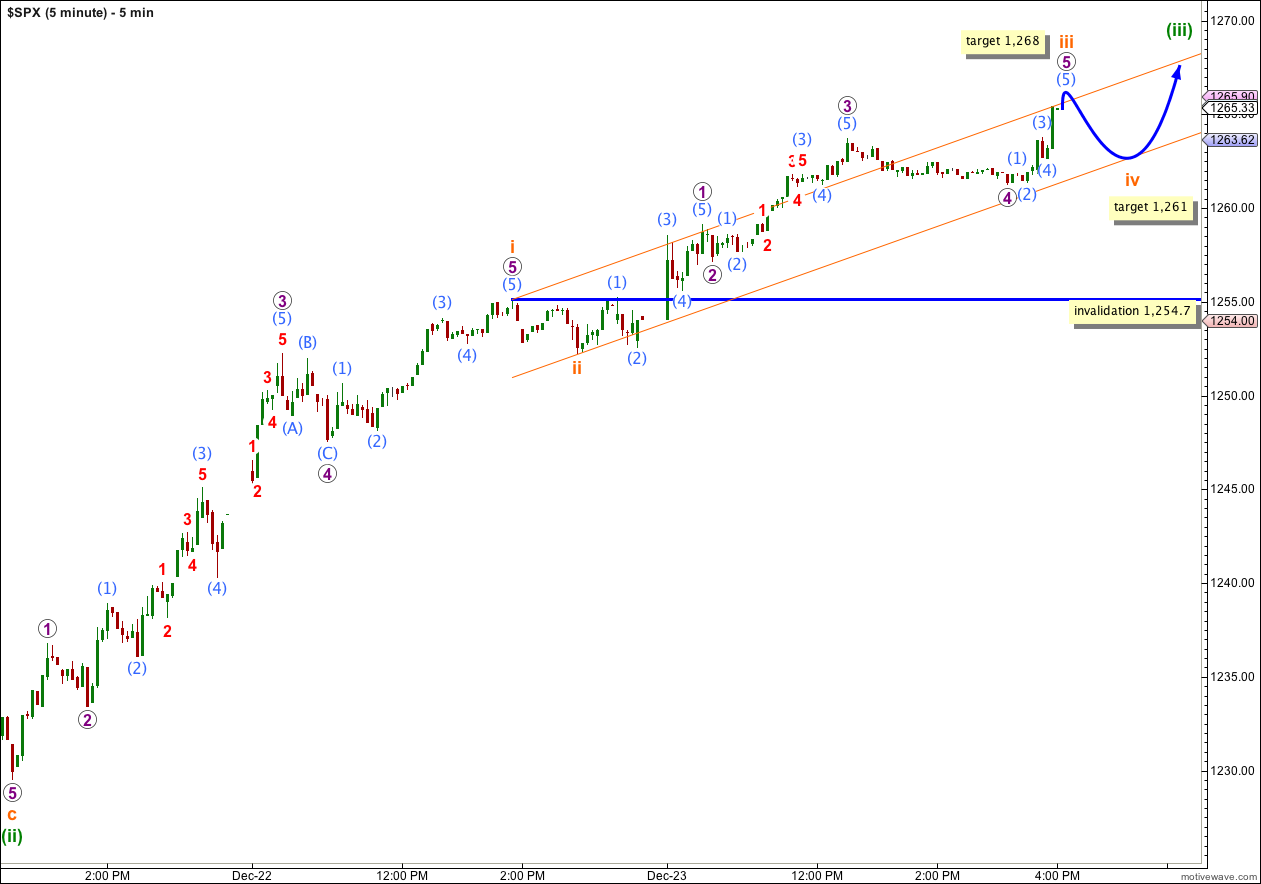
The 5 minute chart above shows the most likely structure for wave (iii) green. At 1,268 wave iii orange would reach 0.618 the length of wave i orange.
When wave iii orange is complete the orange parallel channel should be redrawn. This may show us where wave iv orange ends, about the lower edge of the parallel channel.
Wave iv orange is fairly likely to end about the fourth wave of one lesser degree, about 1,261 (or a little above this point).
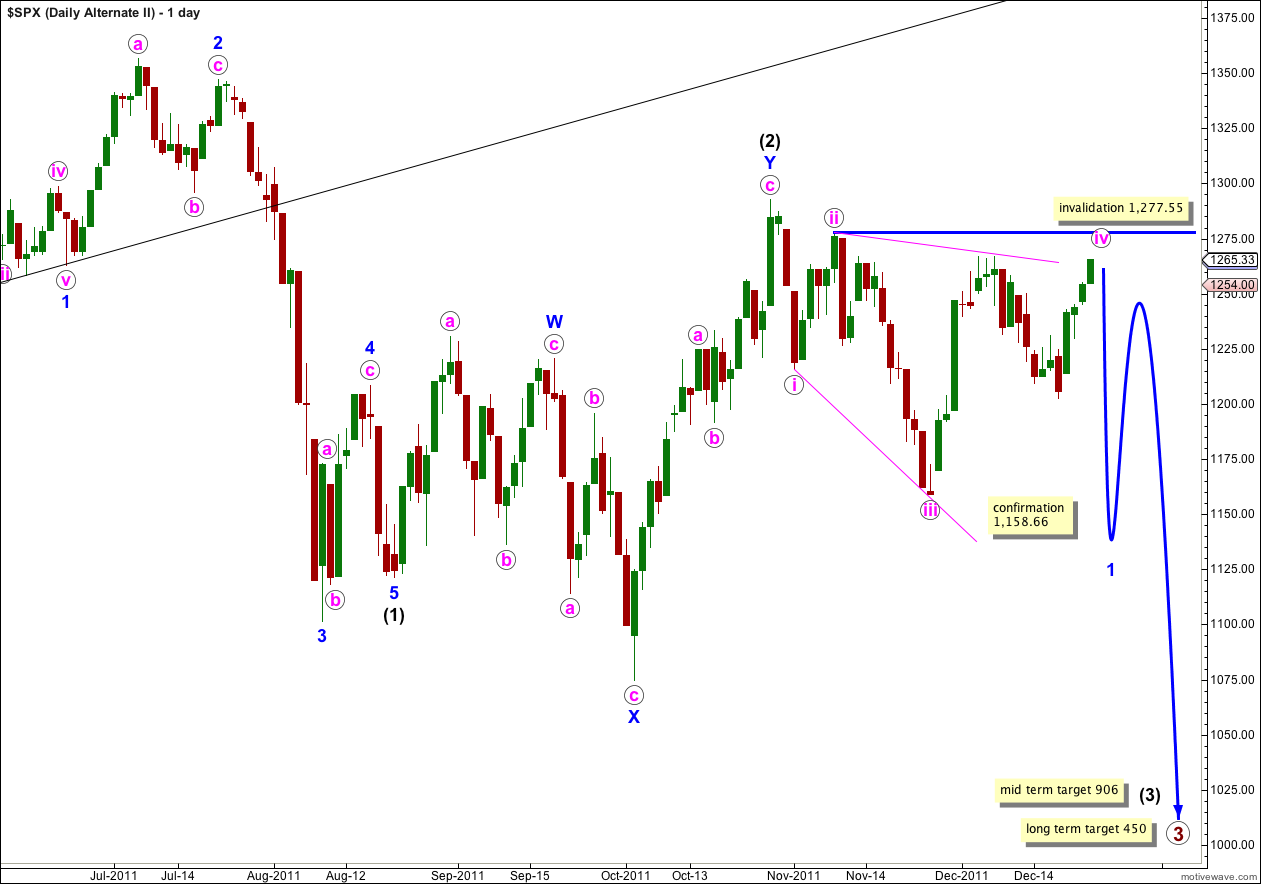
Alternate Wave Count.
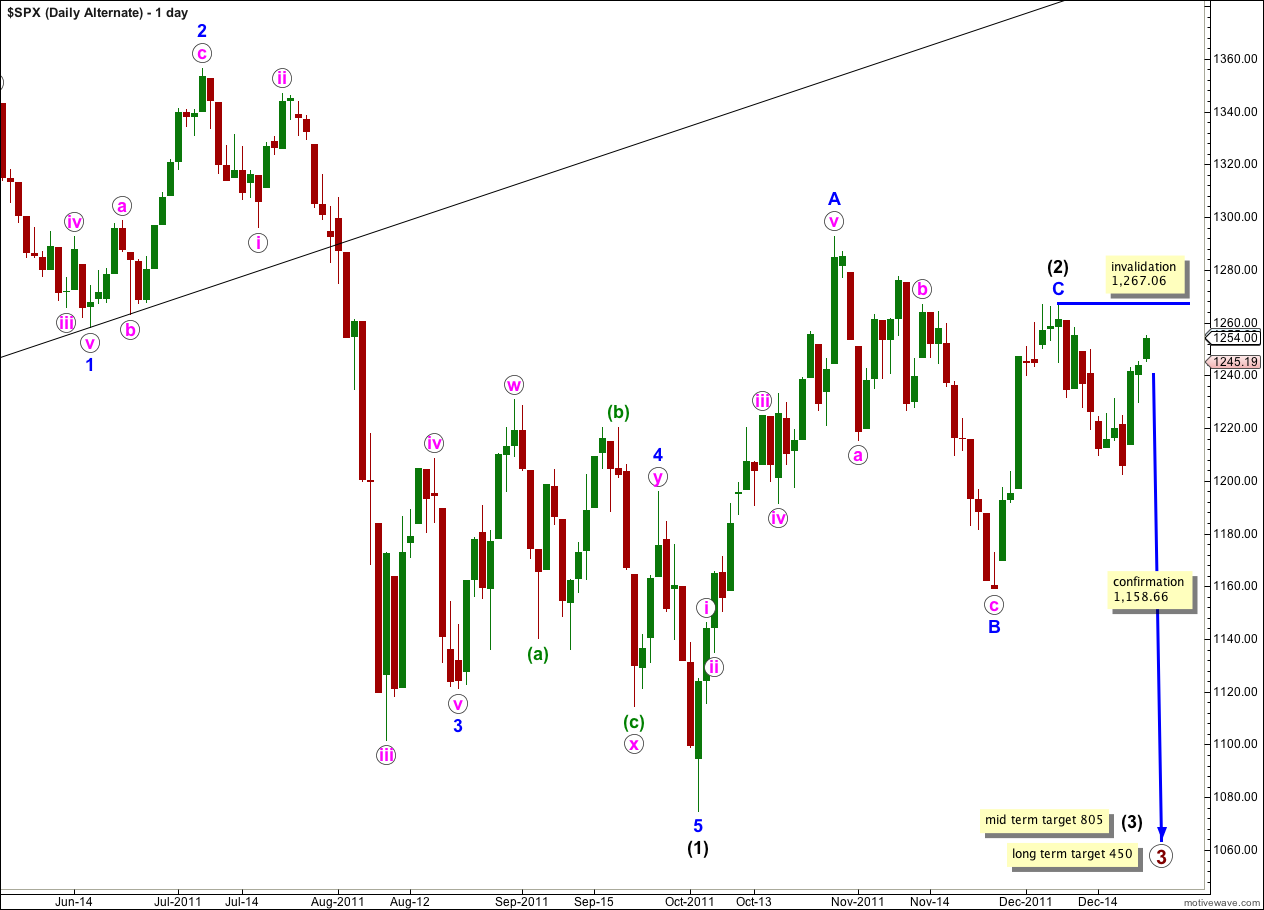
This wave count has a low probability because wave C blue within the zigzag for wave (2) black is severely truncated. However, the subdivisions fit.
Only if we saw very strong downwards movement from this point below 1,158.66 would we need to use this wave count. At that stage it would provide a valid explanation.
Within wave (3) black no second wave correction may move beyond the start of the first wave. This wave count is invalidated with movement above 1,267.06. If this wave count is invalidated by upwards movement then our main wave count could be considered confirmed.
Second Alternate Wave Count.
There are four reasons why I consider this wave count to have the lowest probability:
1. Wave iv pink is not an obvious zigzag and it should be.
2. Wave iv pink is already deeper than 0.81 of wave iii pink; this is the maximum common length for wave 4 within a diagonal in relation to wave 3.
3. While leading diagonals are not uncommon, leading expanding diagonals are supposedly less common structures.
4. A similar wave count on the Dow is invalidated; the Dow and S&P 500 have been moving together nicely for some time and it would be highly unusual for them to now diverge.
Within the leading diagonal for wave 1 blue wave iv pink may not move beyond the end of wave ii pink. This wave count is invalidated with movement above 1,277.55.
A leading diagonal may not have a truncated fifth wave. This wave count requires movement below 1,158.66 to remain valid.
Lara,Merry Christmas and Happy New Year to you and your family,and Thank you for the updates,Raymond.