
Elliott Wave chart analysis for the US Oil for 19th December, 2011. Please click on the charts below to enlarge.
I am using a different data source from previous oil analysis which was WTI Crude. This data seems to be the same and it is probably WTI Crude data also. If not the difference is negligible.
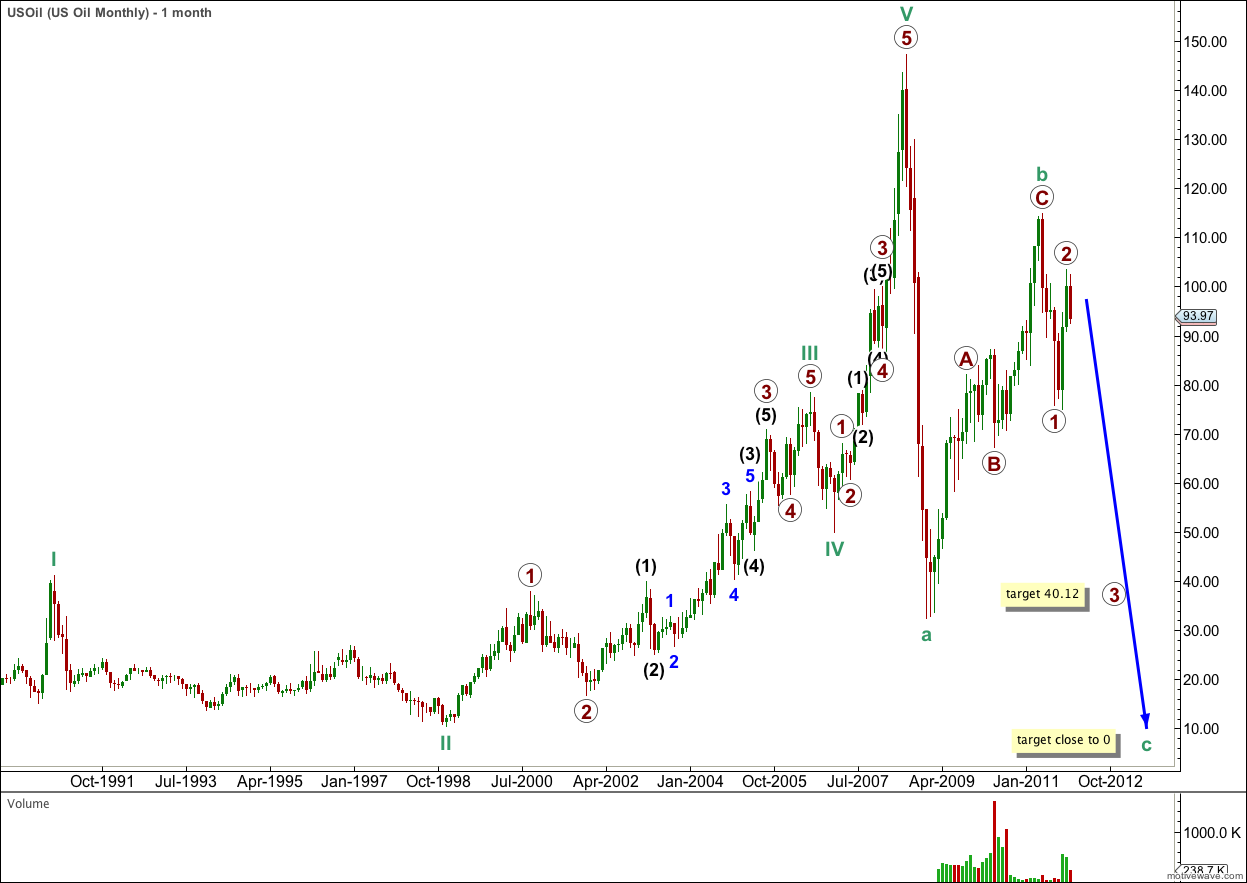
I have altered the monthly analysis to see downwards movement as a three wave correction following the clear five up, because there does not seem to be enough room for a five down.
At cycle degree there are no Fibonacci ratios between cycle waves I, III and V.
Ratios within cycle wave III are: primary wave 3 has no Fibonacci ratio to primary wave 1, and primary wave 5 is just 0.16 longer than 0.382 the length of primary wave 3.
Ratios within primary wave 3 of cycle wave III are: wave (3) black has no Fibonacci ratio to wave (1) black, and wave (5) black is 1.36 longer than equality with wave (1) black.
Ratios within black wave (3) of primary wave 3 of cycle wave III are: wave 3 blue has no Fibonacci ratio to wave 1 blue, and wave 5 blue is just 0.1 longer than 0.618 the length of wave 3 blue.
Ratios within cycle wave V are: primary wave 3 has no Fibonacci ratio to primary wave 1, and primary wave 5 is 14.68 short of 1.618 the length of primary wave 3 (this difference is just less than a 10% variation and so just acceptable).
Ratios within primary wave 3 of cycle wave V are: wave (3) black is 1.69 short of 1.618 the length of wave (1) black, and wave (5) black is 0.94 longer than 0.618 the length of wave (1) black.
Movement below the high of cycle wave III at 78.40 indicates clearly that the upwards trend is over and a new downwards trend (or correction) is underway. Wave behaviour on the monthly chart supports this; the downwards wave labeled cycle wave a is clearly impulsive while the upwards wave labeled cycle wave b is in contrast corrective.
With movement below 81.99, the high labeled primary wave A within cycle wave b, we may consider this confirmation that cycle wave b is complete and cycle wave c downwards should be underway.
Cycle wave c would reach equality with cycle wave a close to zero. If cycle wave c were to have a 0.618 Fibonacci ratio to cycle wave a it would be truncated. We may not see a Fibonacci ratio between cycle waves a and c. When primary waves 3 and 4 within cycle wave c are complete we may use ratios at primary degree to calculate a more accurate target for cycle wave c to end.
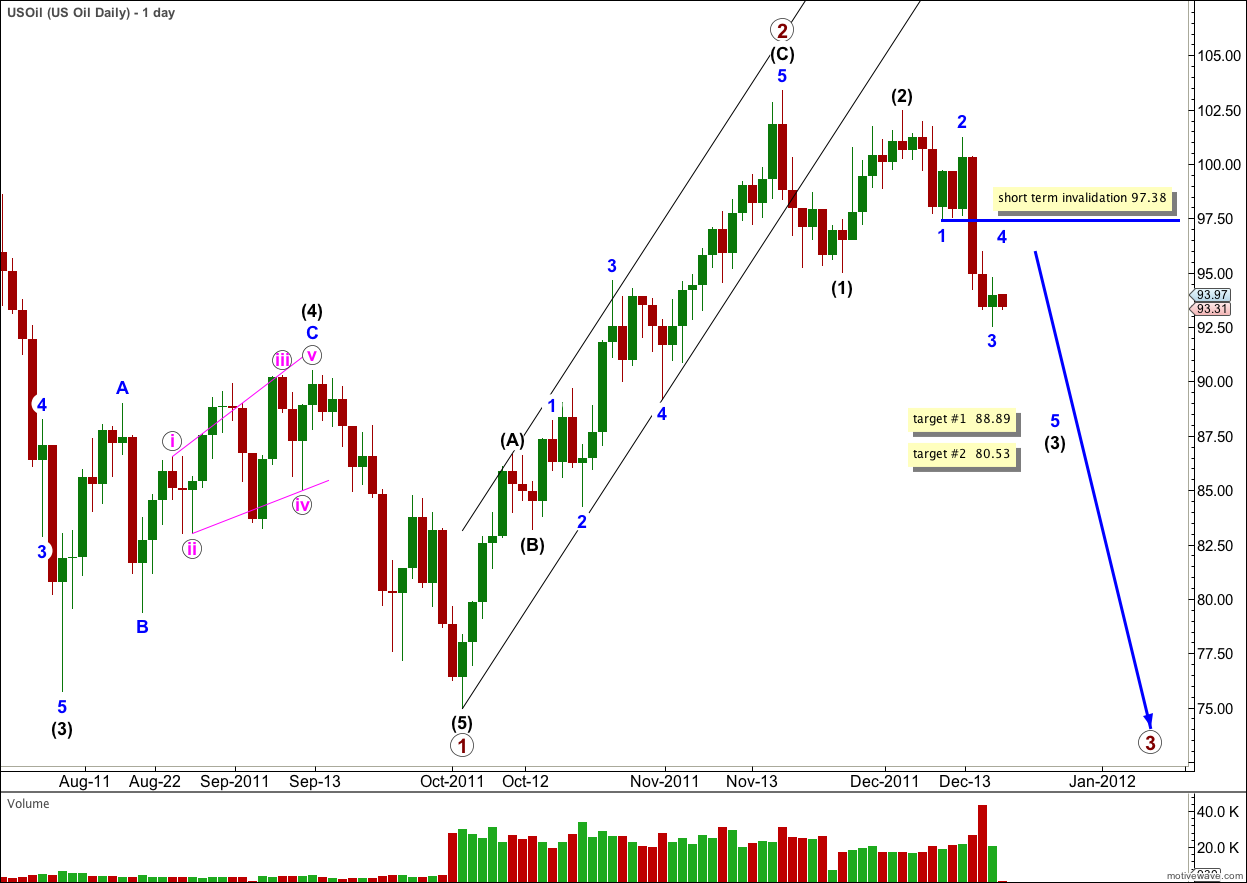
This daily chart shows the end of primary waves 1 and 2 within cycle wave c downwards.
A best fit trend channel containing primary wave 2 upwards has been clearly breached by downwards movement. This may be indication that the upwards correction is over and a third wave down has begun.
Within primary wave 2 wave (C) black is just 1.33 longer than 1.618 the length of black wave (A).
Ratios within black wave (C) of primary wave 2 are: wave 3 blue has no Fibonacci ratio to wave 1 blue, and wave 5 blue is 1.05 short of 2.618 the length of wave 1 blue.
Primary wave 3 must take price beyond the end of primary wave 1. This wave count requires movement below 74.97 to remain valid.
Black wave (1) within primary wave 3 was very brief. We may expect black wave 3 to be longer. At 88.89 it would reach 1.618 the length of black wave (1). At 80.53 wave (3) black would reach 2.618 the length of wave (1) black.
Within wave (3) black wave 4 blue may not move into wave 1 blue price territory. This wave count is invalidated in the short to mid term with movement above 97.38.
thanks for the update Lara
No worries Lewis. I’ll work on getting gold done for you before the end of the week also.