
Elliott Wave chart analysis for the S&P 500 for 14th December, 2011. Please click on the charts below to enlarge.
We have seen downwards movement, which was expected, to reach almost 2 points below our small 1 point target zone.
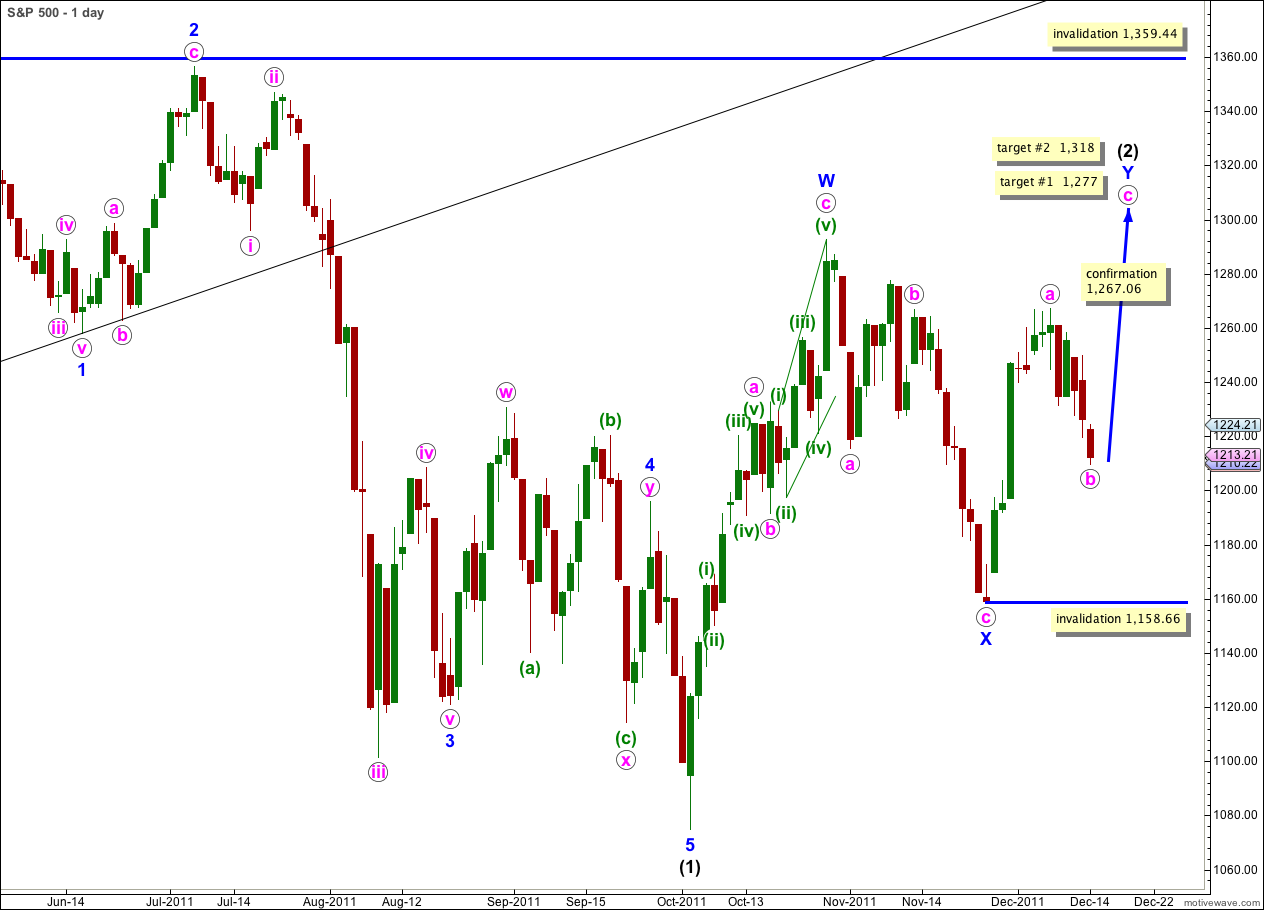
Wave b pink may be complete, and the structure on the hourly and 5 minute charts is complete, so we may again calculate targets for wave c pink to complete the zigzag for wave Y blue.
At 1,277 wave c pink would reach 0.618 the length of wave a pink. If price continues through this first target our second target is at 1,318 where wave c pink would reach equality with wave a pink.
If wave b pink moves any lower we will need to recalculate targets for wave c pink upwards.
Wave b pink may not move beyond the start of wave a pink. This wave count is invalidated with movement below 1,158.66.
Wave (2) black may not move beyond the start of wave (1) black. This wave count is invalidated with movement above 1,359.44.
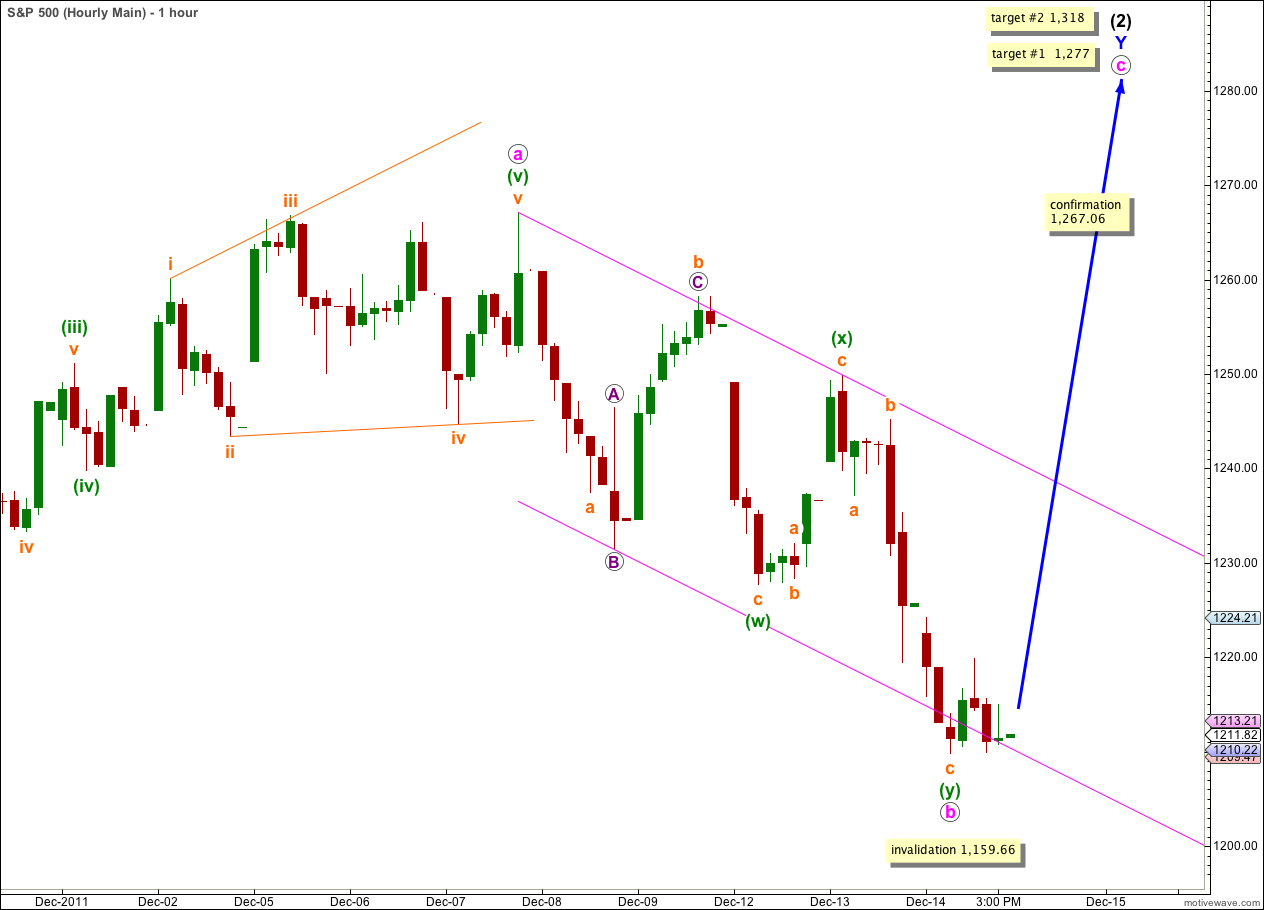
Price reached to 1,209.83, just over one point below the lower edge of our target zone which was 1,211 – 1,212. However, at the end of Wednesday’s session we do not have confirmation of a trend change.
We may draw a best fit trend channel about the double zigzag for wave b pink. The first trend line is drawn from the start of wave (w) green to the end of wave (x) green, and a parallel copy is placed upon the low of wave B purple within wave (w) green. When we see movement above this parallel channel we shall have confirmation of a trend change. At that stage wave c pink should be underway.
Alternate Wave Count.
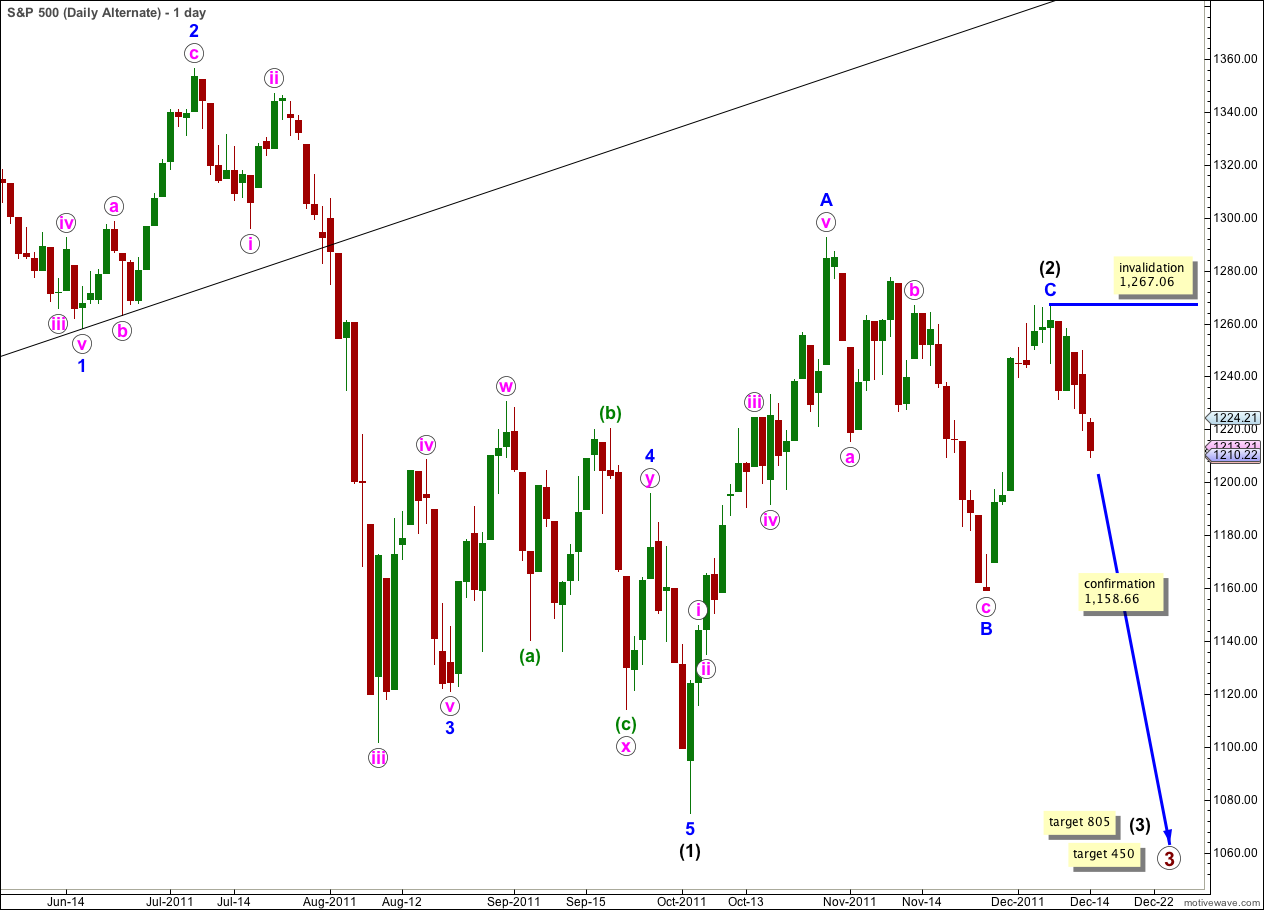
This wave count has a low probability because wave C blue within the zigzag for wave (2) black is severely truncated. However, the subdivisions fit.
Only if we saw very strong downwards movement from this point below 1,158.66 would we need to use this wave count. At that stage it would provide a valid explanation.
Within wave (3) black no second wave correction may move beyond the start of the first wave. This wave count is invalidated with movement above 1,267.06. If this wave count is invalidated by upwards movement then our main wave count could be considered confirmed.
Second Alternate Wave Count.
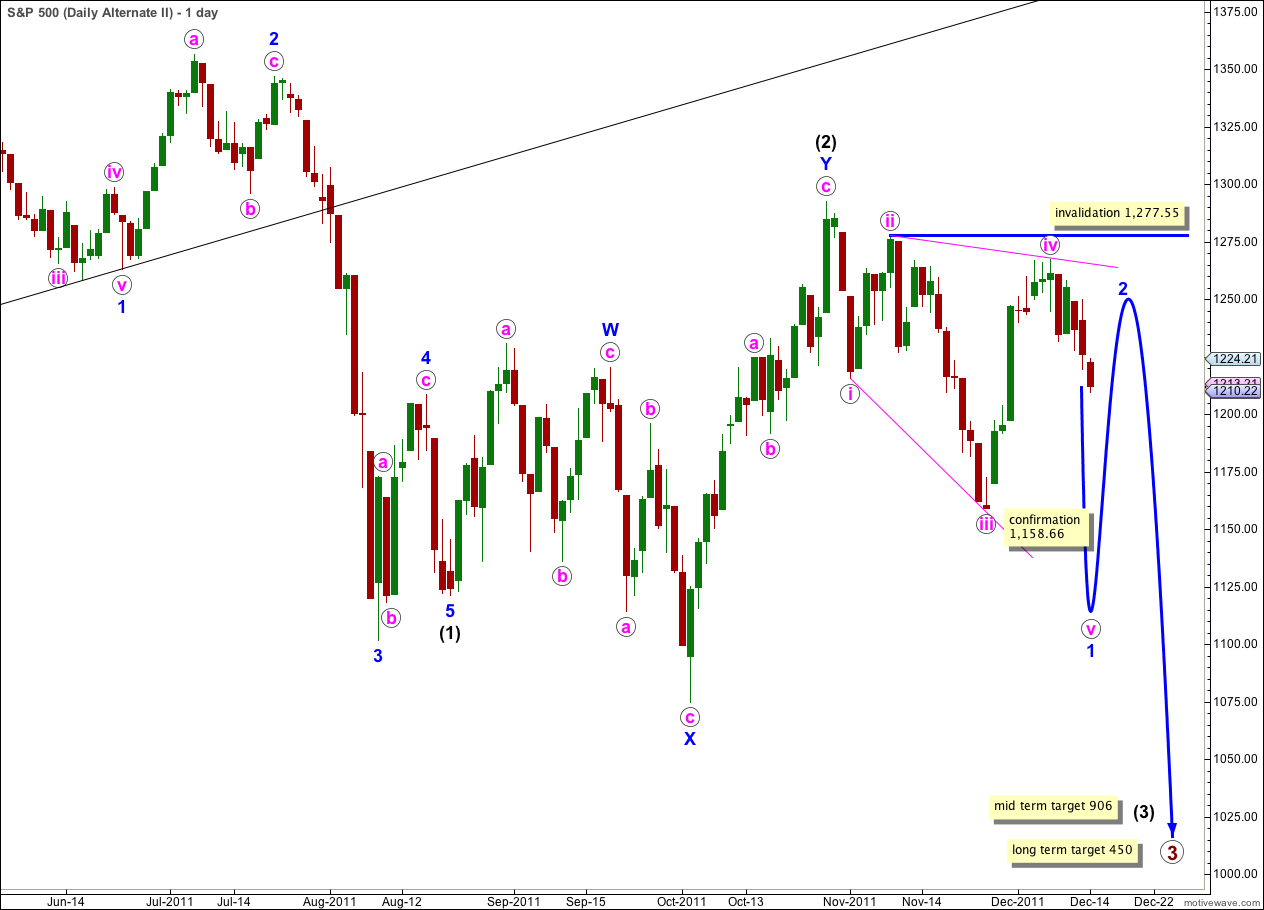
There are four reasons why I consider this wave count to have the lowest probability:
1. wave iv pink is not an obvious zigzag and it should be.
2. wave iv pink is already deeper than 0.81 of wave iii pink; this is the maximum common length for wave 4 within a diagonal in relation to wave 3.
3. while leading diagonals are not uncommon, leading expanding diagonals are supposedly less common structures.
4. a similar wave count on the Dow is invalidated; the Dow and S&P 500 have been moving together nicely for some time and it would be highly unusual for them to now diverge.
Within the leading diagonal for wave 1 blue wave iv pink may not move beyond the end of wave ii pink. This wave count is invalidated with movement above 1,277.55.
A leading diagonal may not have a truncated fifth wave. This wave count requires movement below 1,158.66 to remain valid.
Correction, march is now the forward contract. It hit 1198 for a low.
e-mini overnight traded to a low of 1204.75 filling more of the gap. That may be enough for now…
Further, it may be closing the 11/30 gap down to 1197 ish. We shall see…
Good call on the target, again. This wave down looks tired. Money may be flowing from gold and oil into this market. My instincts say it will pop up very soon.