
Elliott Wave chart analysis for the S&P 500 for 9th December, 2011. Please click on the charts below to enlarge.
Last analysis expected downwards movement for Friday’s session but price has moved strongly higher to retrace 75% of Thursday’s losses.
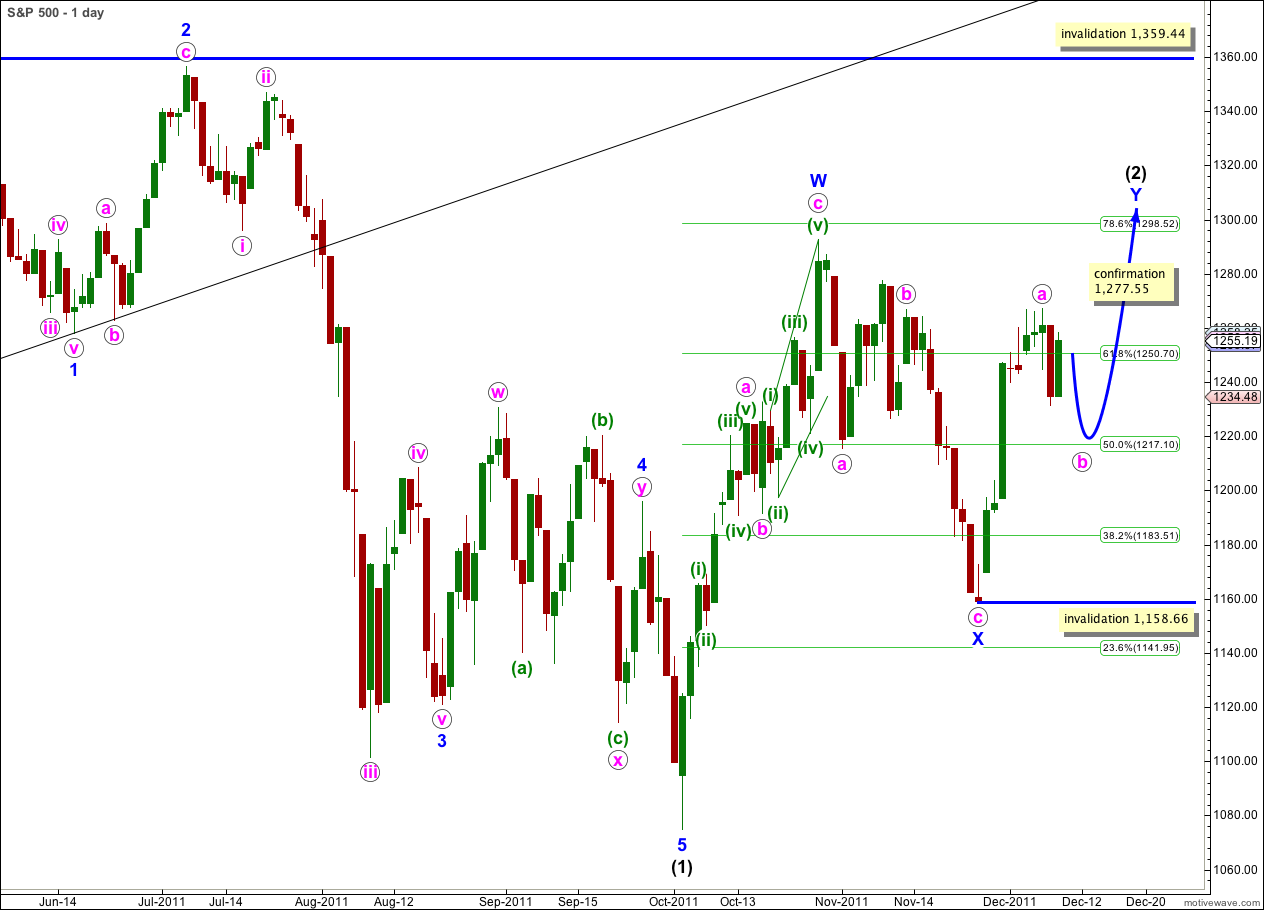
Wave b pink within wave Y blue zigzag is unfolding as either a zigzag, a flat or a triangle. It should take another day or two to complete, most likely.
Within the zigzag for wave Y blue it is highly likely that wave c pink to end it would take price above the high of wave a pink at 1,267.06 to avoid a truncation.
The purpose of a double zigzag is to deepen a correction and the probability that wave Y blue would take price to a new high above the end of wave W blue at 1,292.66 is high.
Wave (2) black may not move beyond the start of wave (1) black. This wave count is invalidated with movement above 1,359.44.
Because there is variation within the structure of wave b pink I have two hourly wave counts for our main daily wave count today.
Hourly Wave Count I.
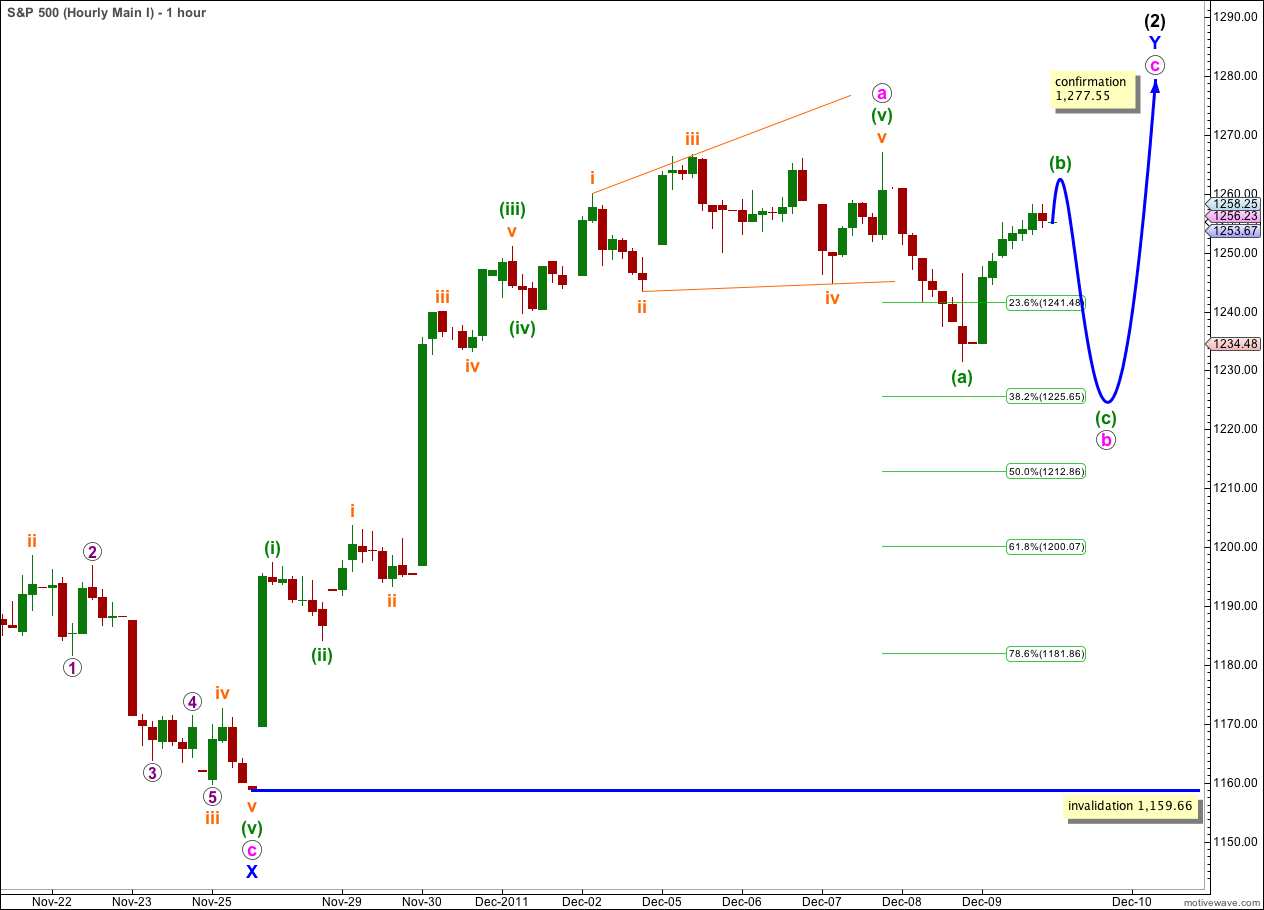
I would expect wave b pink to last longer than one day and this is the more likely of our two hourly wave counts.
On the 5 minute chart wave (a) green looks most like a three wave structure. This indicates either a flat or a triangle unfolding for wave b pink, with a flat correction most likely because it is much more common.
A flat correction requires wave (b) green to be at least 90% the length of wave (a) green. This is achieved at 1,263.5. A little upwards movement to this price point at least is likely when markets open on Monday. Within a flat correction wave (b) green may move beyond the start of wave (a) green and there can be no short term upper invalidation point.
Thereafter, wave (c) green downwards should most likely make a new low below the end of wave (a) green at 1,231.47, in order to avoid a truncation and a rare running flat.
The other possibility is that wave b pink may unfold as a triangle. If this is the case then we would most likely see downwards movement to start Monday’s session, and it is most likely that price will remain below 1,262.75 (or very close to this point) and above 1,231.47. The most common type of triangle is a contracting triangle as expanding triangles are very rare.
However, a contracting triangle may have wave (b) green which ends beyond the start of wave (a) green and a new high to begin the session on Monday does not rule out a triangle.
Wave b pink may not move beyond the start of wave a pink. This wave count is invalidated with movement below 1,159.66.
Hourly Wave Count II.
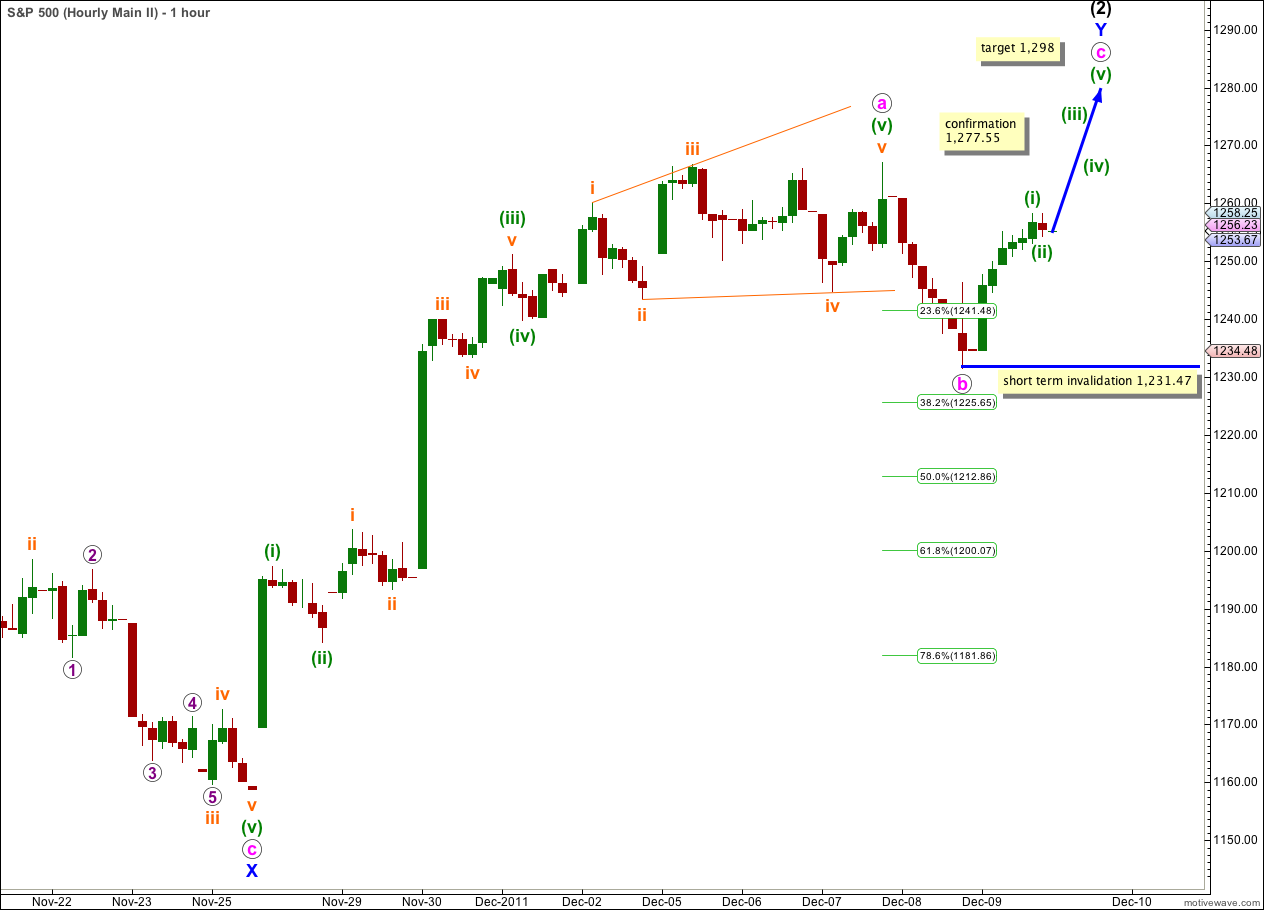
Because on the 5 minute chart the structure of wave b pink is most easily seen as a three wave structure, we must consider the possibility that wave b pink is already over and wave c pink is underway.
Unfortunately, because there is no upper short term invalidation point for the Hourly Wave Count I, there can be no upper confirmation point for this Hourly Wave Count II.
The structure of wave c pink upwards so far would be wave (i) green as it is a complete five wave impulse on the 5 minute chart. Wave (ii) green may not move beyond the start of wave (i) green. This wave count is invalidated with movement below 1,231.47.
This wave count is possible but it has a lower probability than the first hourly wave count, simply because we would expect wave b pink to last longer than one day.
Alternate Daily Wave Count.
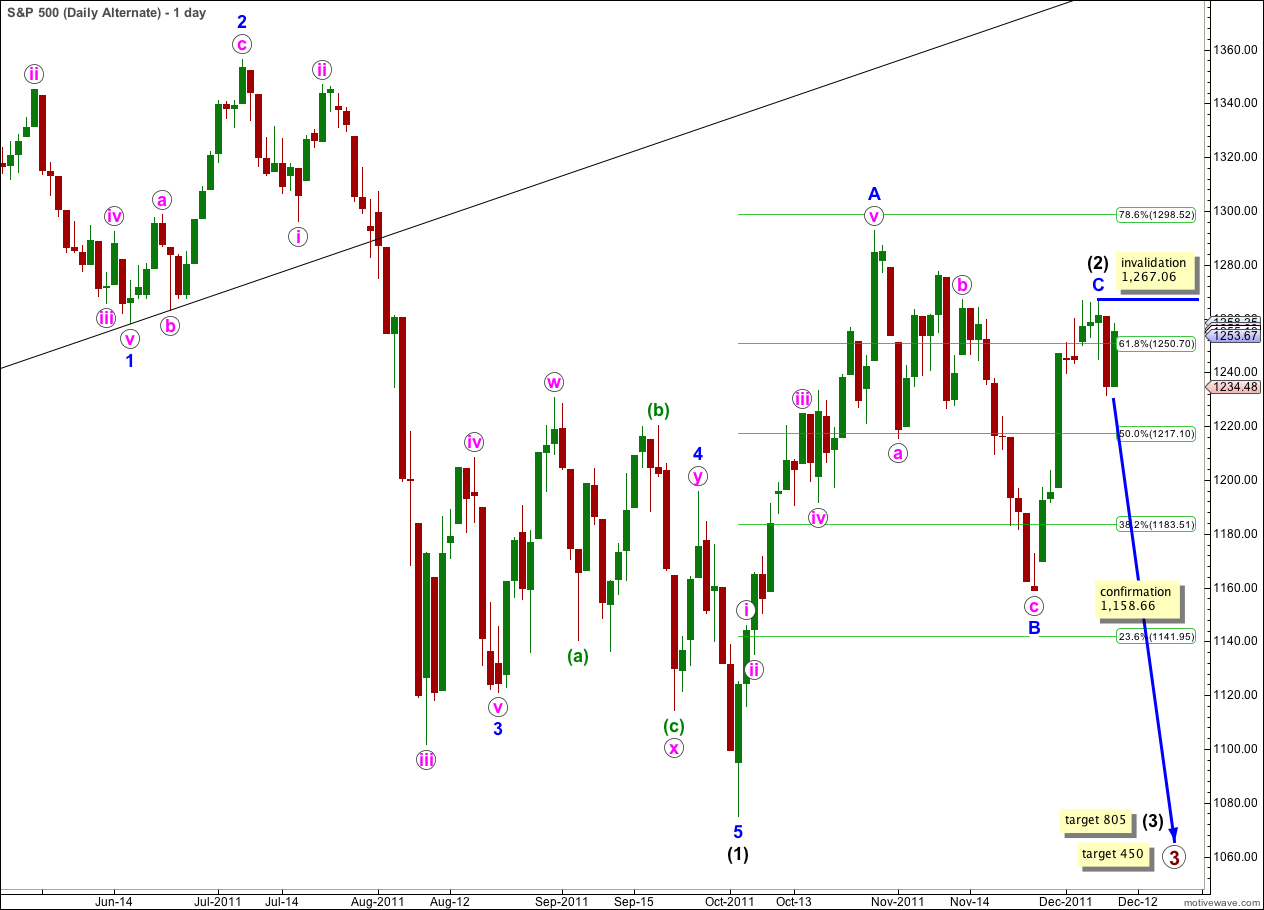
It is still possible that wave (2) black is a complete double zigzag and wave (3) black has begun. Wave behaviour for Friday’s session does not entirely support this wave count, but it does not invalidate it either. Subdivisions on the 5 minute chart do not support this wave count.
This wave count has a good fit, all the subdivisions are easily correct, but it involves a severe truncation for wave C blue of the zigzag that is wave (2) black. This reduces the probability of this wave count, but does not invalidate it.
Any movement above 1,267.06 would immediately invalidate this wave count as within wave (3) black no second wave correction may move beyond the start of the first wave.
Second Alternate Daily Wave Count.
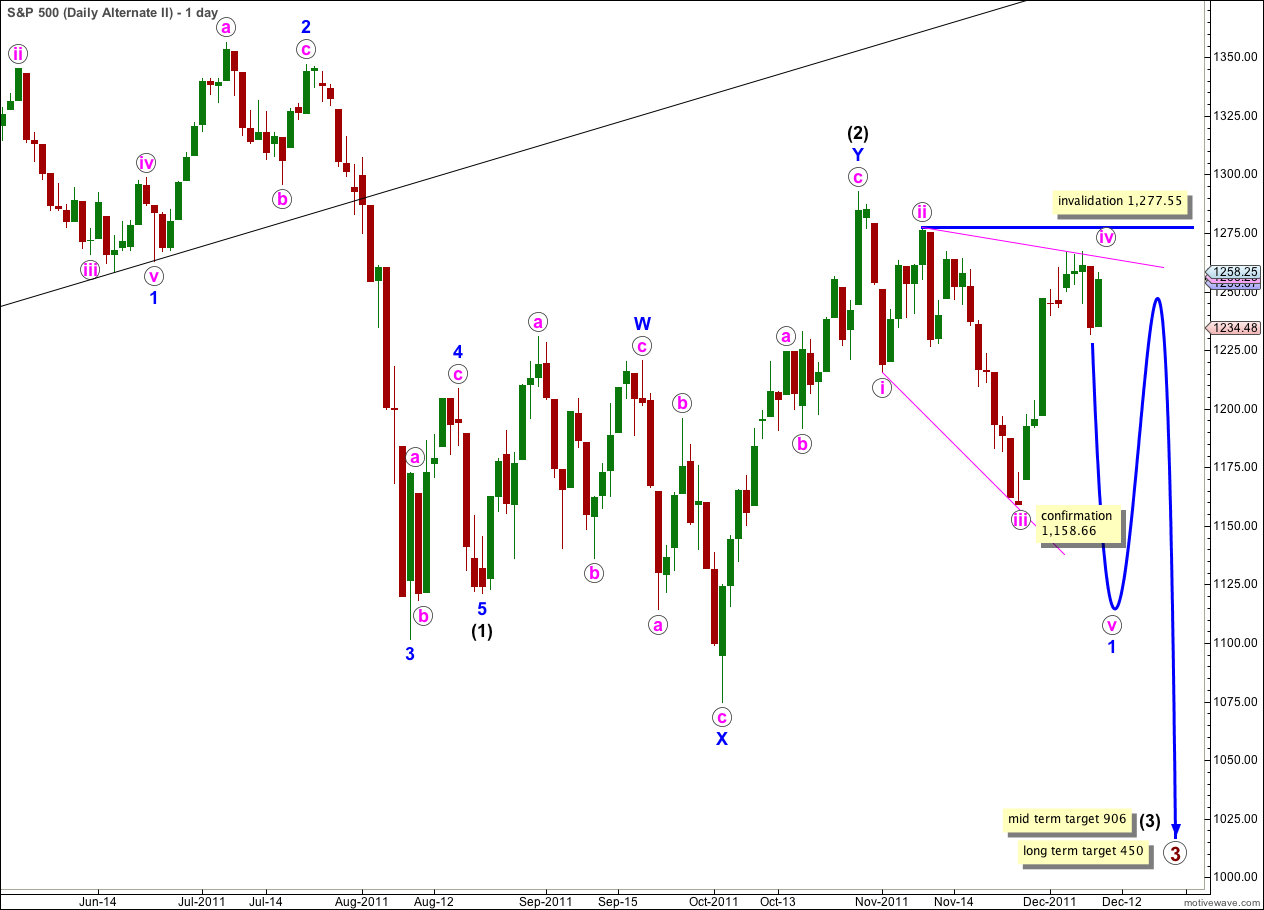
If price moves above 1,267.06 but remains below 1,277.55 in the next day or two this wave count would be viable.
At this stage the structure of wave iv pink is an incomplete zigzag.
This wave count still has the lowest probability of all three, and it is also invalidated on the Dow which further reduces its probability.
There are four reasons why I consider it to have the lowest probability:
1. wave iv pink is not an obvious zigzag and it should be.
2. wave iv pink is already deeper than 0.81 of wave iii pink; this is the maximum common length for wave 4 within a diagonal in relation to wave 3.
3. while leading diagonals are not uncommon, leading expanding diagonals are supposedly less common structures.
4. a similar wave count on the Dow is invalidated; the Dow and S&P 500 have been moving together nicely for some time and it would be highly unusual for them to now diverge.
Lara, do you include the price action for after hours trading in your analysis?
No. The data I’m using is S&P 500 cash index data which only covers in session trading.
Some of your targets are very close in after hours. For example, SPX did rise significantly on Friday. i believe it reached 1265 which would validate your analysis…
Wow, thanks for letting me know. I had no idea.
Although it has not quite met the targets I’ve had for the last few days I’m still pretty happy with the overall direction. So far it seems to be unfolding as a typical zigzag, and the B wave within it a typical three also.
If this is right then we’ve got a week to a week and a half of upwards movement, to end the year, and the new year should see a dramatic drop.
We shall see…
Yes, not to belabor the subject, but on the last leg down you forecast 1145 as the target. In after hours it hit 1148 or so prior to the bounce back up…