
[Note: I’m experiencing video upload problems with my Internet connection. Today’s video will be uploaded and like yesterday it will be late. I apologize for this inconvenience.]
Elliott Wave chart analysis for the S&P 500 for 1st December, 2011. Please click on the charts below to enlarge.
Price has mostly moved sideways during Thursday’s session, with a slight new high made. Price remains below the invalidation point at 1,266.36 and both wave counts remain valid.
I have finally found an acceptable wave count which sees wave (1) black over at the price low of 1,074.77 and upwards movement as wave (2) black. We can now discard the highly unlikely looking alternate we were using. This new wave count is at the end of this analysis.
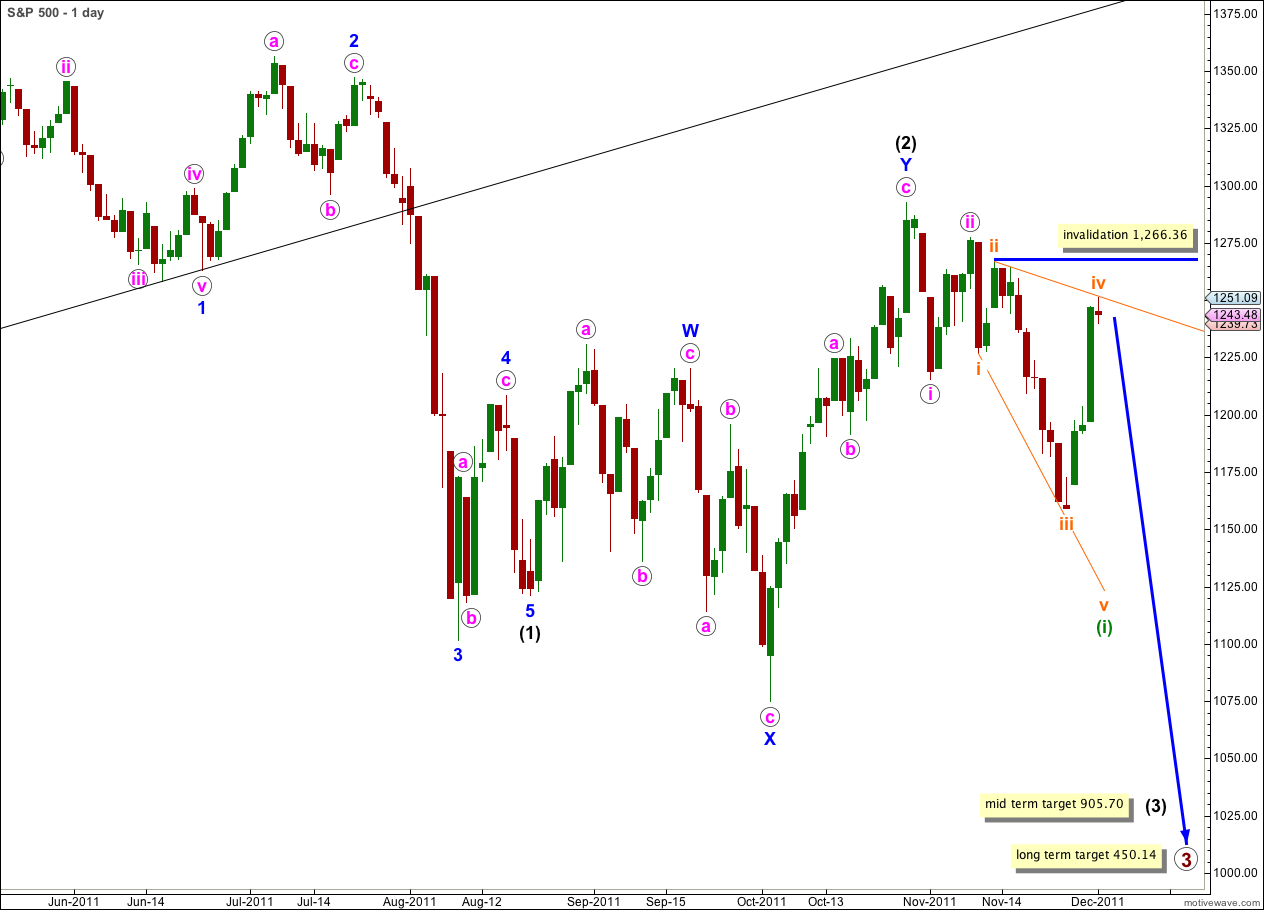
If this main wave count is correct then we should expect downwards movement for wave v orange to complete the leading expanding diagonal for wave (i) green.
Following a leading diagonal in a first wave position we would expect a very deep second wave correction. Wave (ii) green should reach to about 0.786 the length of wave (i) green.
Wave iv orange may not move beyond the end of wave ii orange. This wave count is invalidated with movement above 1,266.36.
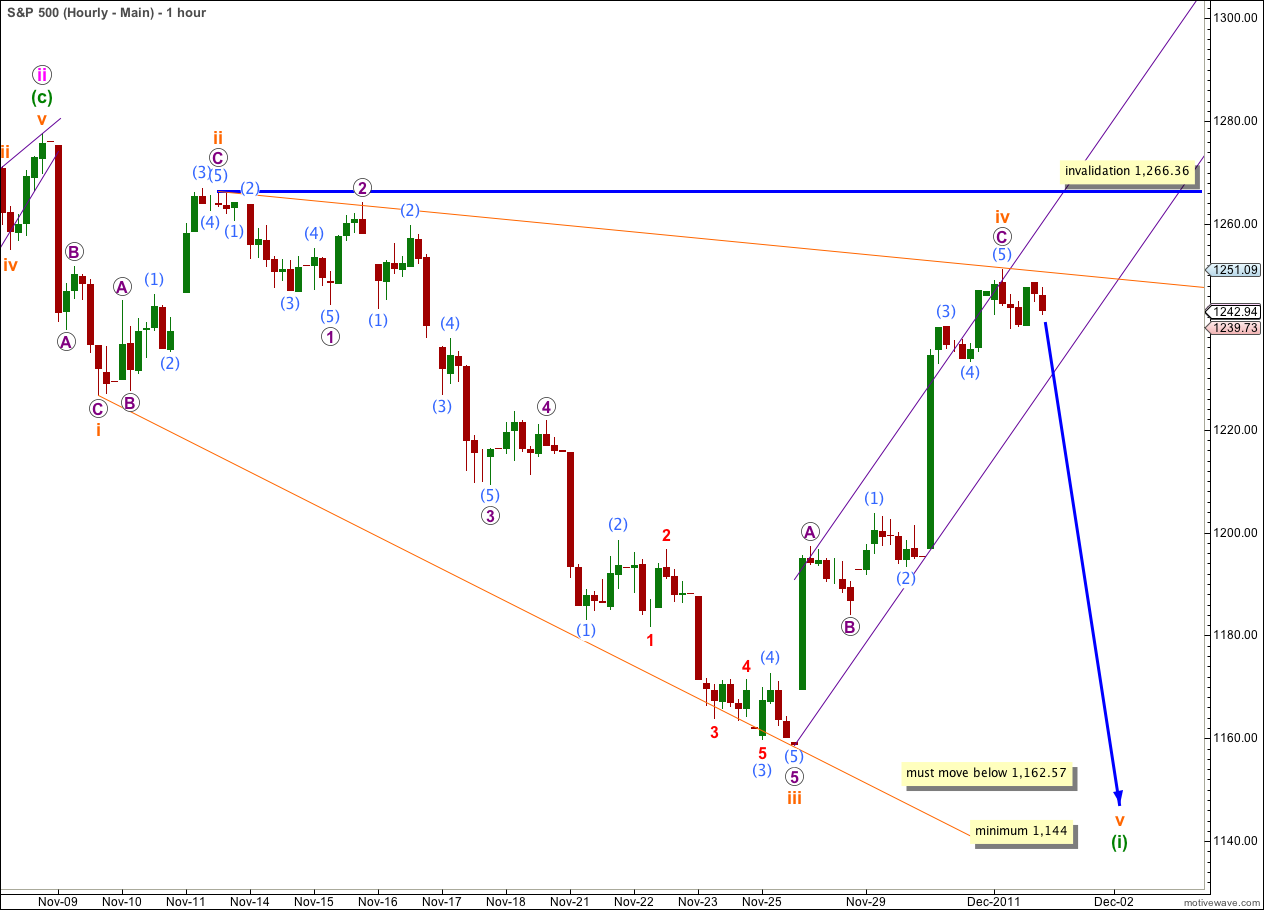
A slightly higher high has improved the Fibonacci ratios within wave C purple of the zigzag for wave iv orange.
Within wave iv orange wave C purple is now 4.82 points longer than 1.618 the length of wave A purple.
Ratios within wave C purple are: wave (3) aqua is 4.49 points short of 2.618 the length of wave (1) aqua, and wave (5) aqua is now just 0.01 short of 0.382 the length of wave (3) aqua.
Price remains well within the parallel channel containing the zigzag. We have no indication yet of a trend change.
A leading diagonal may not have a truncated fifth wave and wave v orange must take price to a new low below 1,162.57. The diagonal is expanding and wave v orange should be at least as long as wave iii orange. It would reach equality with wave iii orange at 1,144. However, I often see diagonals where the third wave is the longest and this minimum target may not be met.
Within a diagonal wave 4 should overlap into wave 1 price territory but may not move beyond the end of wave 2. This wave count is invalidated with movement above 1,266.36.
Alternate Wave Count.
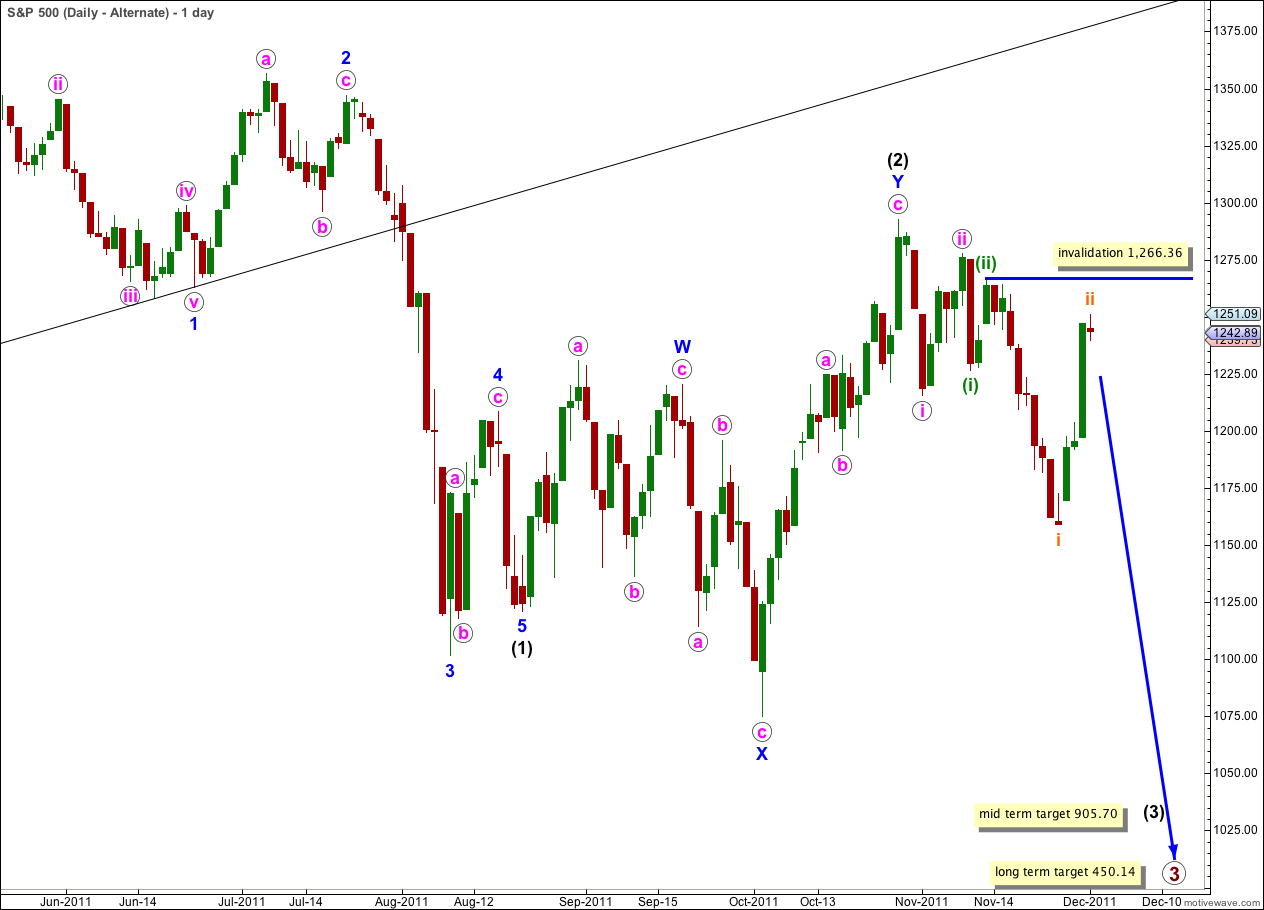
This alternate wave count also remains valid, but it looks less likely than the main wave count. We would not expect a subminuette wave to look so large on the daily chart, and it is larger than waves of two degrees higher which gives this wave count a slightly strange look. However, it is technically possible and has a reasonable probability.
Wave ii orange may not move beyond the start of wave i orange. This wave count is invalidated with movement above 1,266.36.
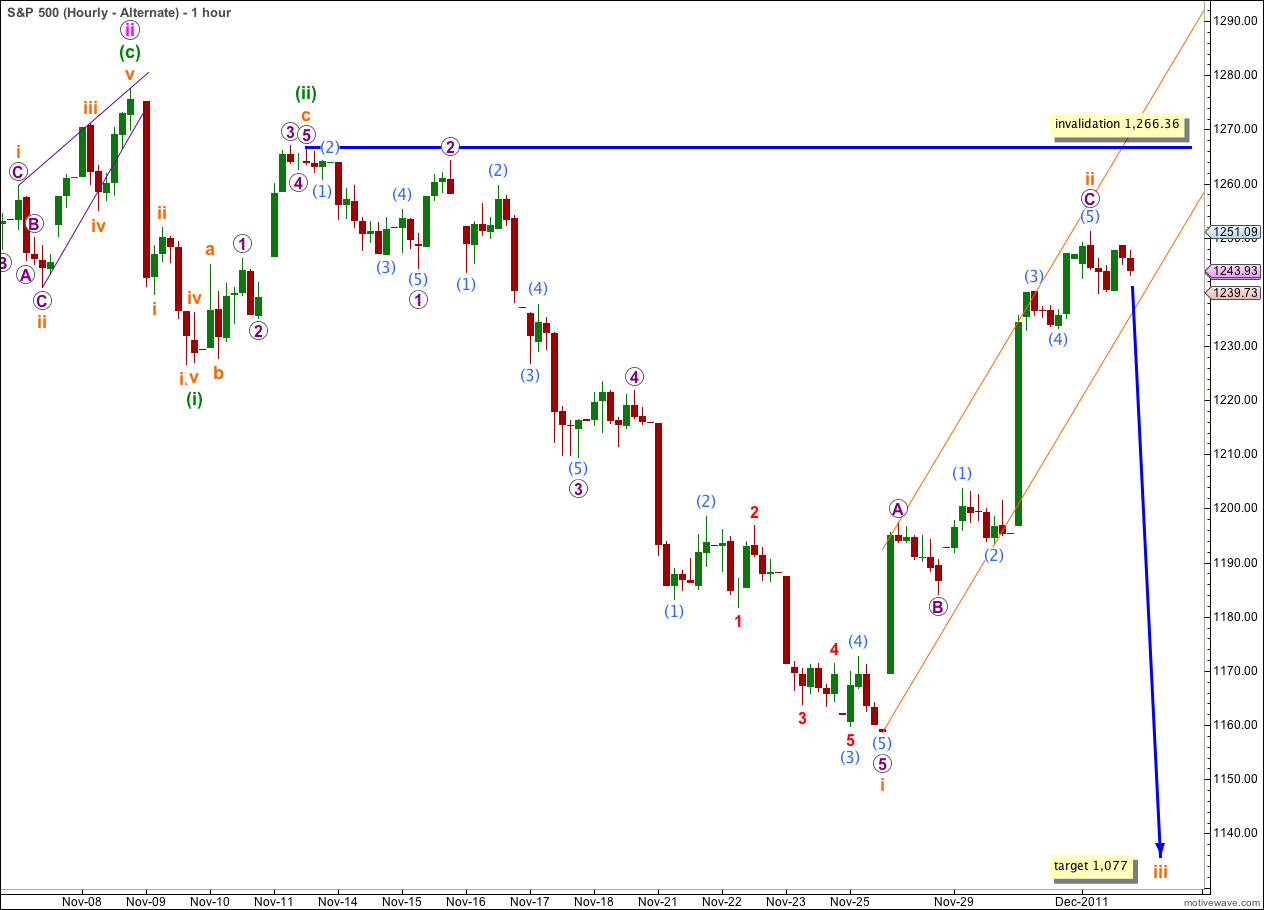
This hourly chart shows the whole structure of wave iii pink so far.
Wave ii orange is out of proportion to wave (ii) green, one degree higher, and this gives the wave count a strange look. This reduces the probability.
At 1,077 wave iii orange would reach 1.618 the length of wave i orange.
Wave ii orange may not move beyond the start of wave i orange. This wave count is invalidated with movement above 1,266.36.
If price does move above 1,266.36 we should use the alternate below.
Second Alternate Wave Count.
This alternate wave count has a good fit and good proportions.
Within wave (1) black there are no adequate Fibonacci ratios at blue degree.
Ratios within wave 1 blue are: wave iii pink has no Fibonacci ratio to wave i pink, and wave v pink is 4.06 points longer than 0.382 the length of wave iii pink.
Ratios within wave 3 blue are: wave iii pink is 11.07 points short of 4.236 the length of wave i pink, and wave v pink is 6.39 points short of 0.382 the length of wave iii pink.
Wave 2 blue is a single zigzag and wave 4 blue a double zigzag.
The only concern I have with this wave count is the structure of 4 blue. Both waves W and Y pink are zigzags, and the purpose of a double zigzag is to deepen a correction. Here it has moved price mostly sideways and the purpose is not achieved.
All the subdivisions fit perfectly.
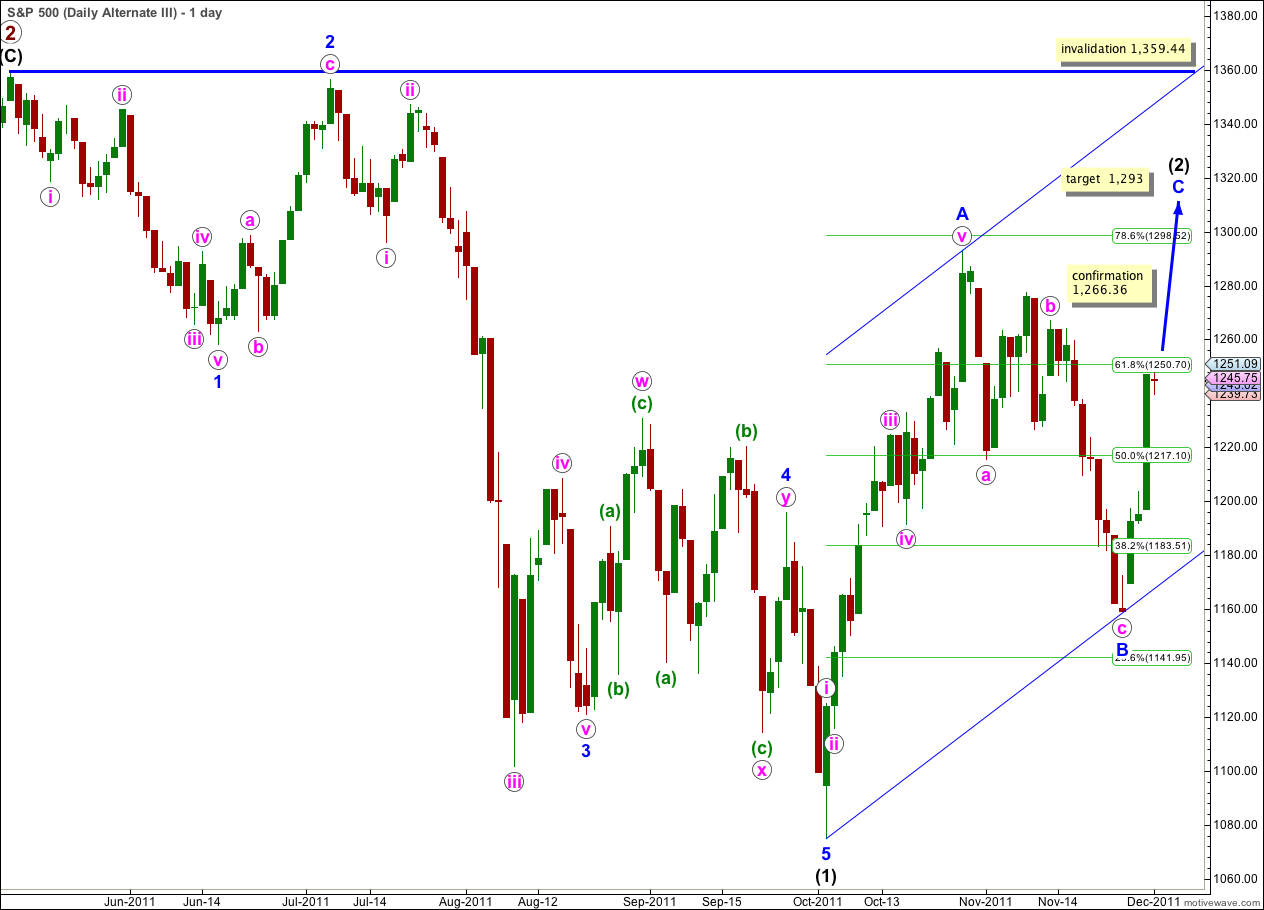
Wave (2) black may yet be unfolding further as a large zigzag. It may end with a small overshoot of the 0.786 Fibonacci ratio of wave (1) black.
At 1,293 wave C blue would reach 0.618 the length of wave A blue.
It is very likely if this wave count is correct that price will move above the high labeled A blue at 1,292.66 to avoid a truncation.
If 1,266.36 is breached expect upwards movement to continue above 1,292.66. The highest probability target is the second target at 1,377.
Wave (2) black may not move beyond the start of wave (1) black. This wave count is invalidated with movement above 1,359.44.
Lara,
Is it possible in your alternate, which sees Black 2 as incomplete, that Black 2 is unfolding as a double zig zag, where A (or W) was actually a 3 wave structure, and C (or Y) will also be a three? Thanks.
Peter
Yes, and this is another alternate we will have to consider. The invalidation points are the same, the only difference is the structure we expect would be a zigzag rather than an impulse, and the target calculation will differ slightly.
hi, could wave 4 blue end where you have w circle and then start an ending diagonal to end where you lable 5 blue?
Hi Julio, I have considered this wave count you outline, and I know others are using it, but I have two big problems with it.
First, if 4 blue ended at the high labeled W pink on my second alternate daily chart then wave b pink within 4 blue would be the piece of movement labeled v pink of 3 blue. This piece of movement is a clear five wave impulse, it is not ambiguous, and such a wave count would have to see it as a three wave zigzag. I do not want to consider any wave count which does that. Such a wave count could not possibly be correct. If you start fudging it like that then there really is no point in trying to practice Elliott wave. I have gone over that piece of movement carefully on a 5 minute chart because it is so critical.
Second, an ending diagonal starting from the high labeled W pink and ending at the low labeled (1) black has a problem with the wave lengths. Wave 4 would be slightly shorter than wave 1, indicating the diagonal should be contracting. But wave 5 would be longer than 3 which would be longer than wave 1 indicating an expanding diagonal. I could consider this at lower wave degrees on an hourly chart, but not at minute degree on the daily chart. I know wave lengths of diagonals are not always what the rules say they should be, but the only alteration that I would consider making to the rules would be to say that sometimes the third wave can still be the longest.