
Elliott Wave chart analysis for the S&P 500 for 17th November, 2011. Please click on the charts below to enlarge.
Last analysis expected further downwards movement and this is what we have clearly seen during Thursday’s session.
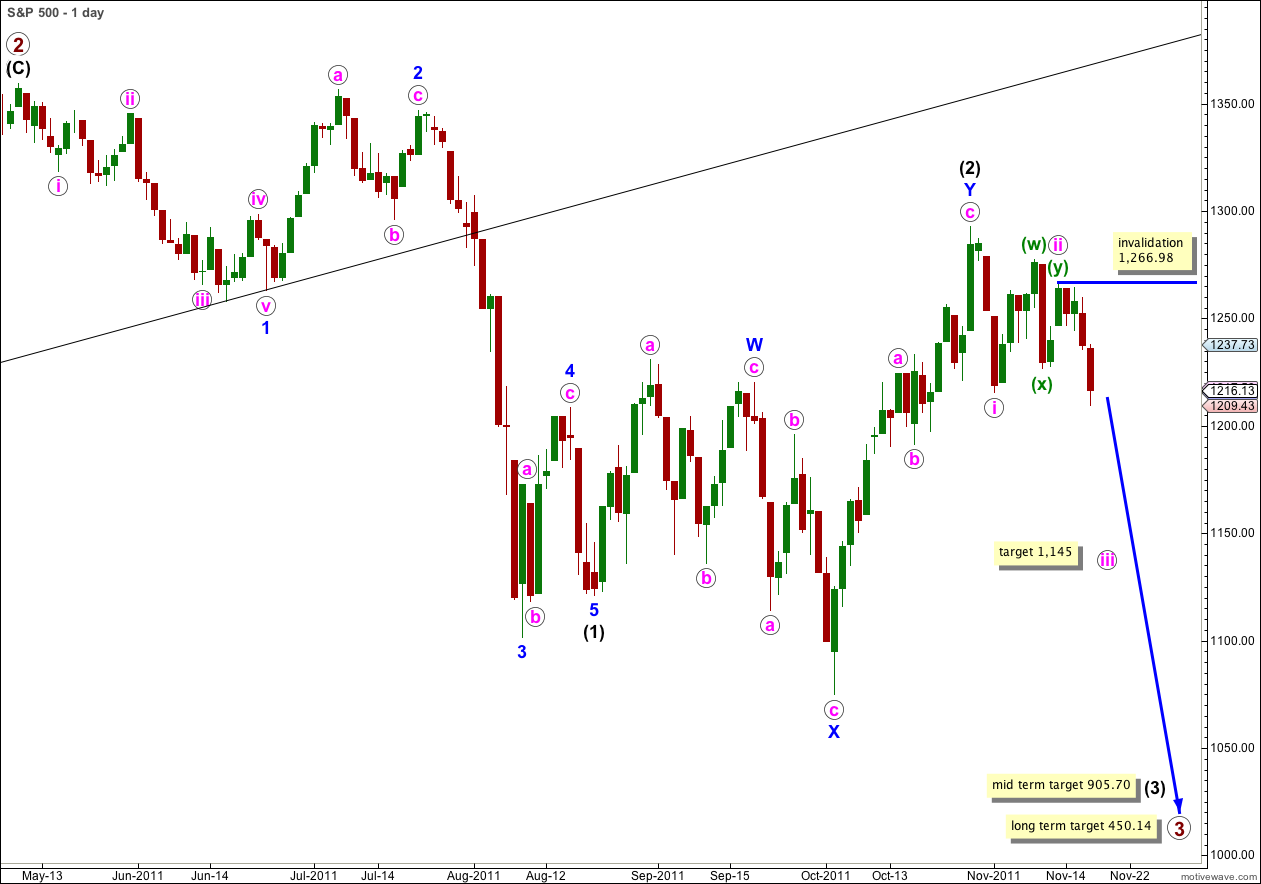
Wave iii pink is not over and we should expect further downwards movement yet before we see a correction for wave iv pink.
Wave iii pink has now moved beyond the end of wave i pink. We may move the invalidation point downwards on the daily chart today. Within wave iii pink no second wave correction may move beyond the start of the first wave. This wave count is invalidated with movement above 1,266.98.
Targets remain the same. At 905.70 wave (3) black will reach 1.618 the length of wave (1) black. With corrections being time consuming this mid term target is probably still weeks away.
At 450.14 primary wave 3 would reach equality in length with primary wave 1. This long term target is still months away.
I had expected Thursday’s session to begin with a little upwards movement. This did not happen, price began falling immediately, and the first target on the hourly chart was met very closely.
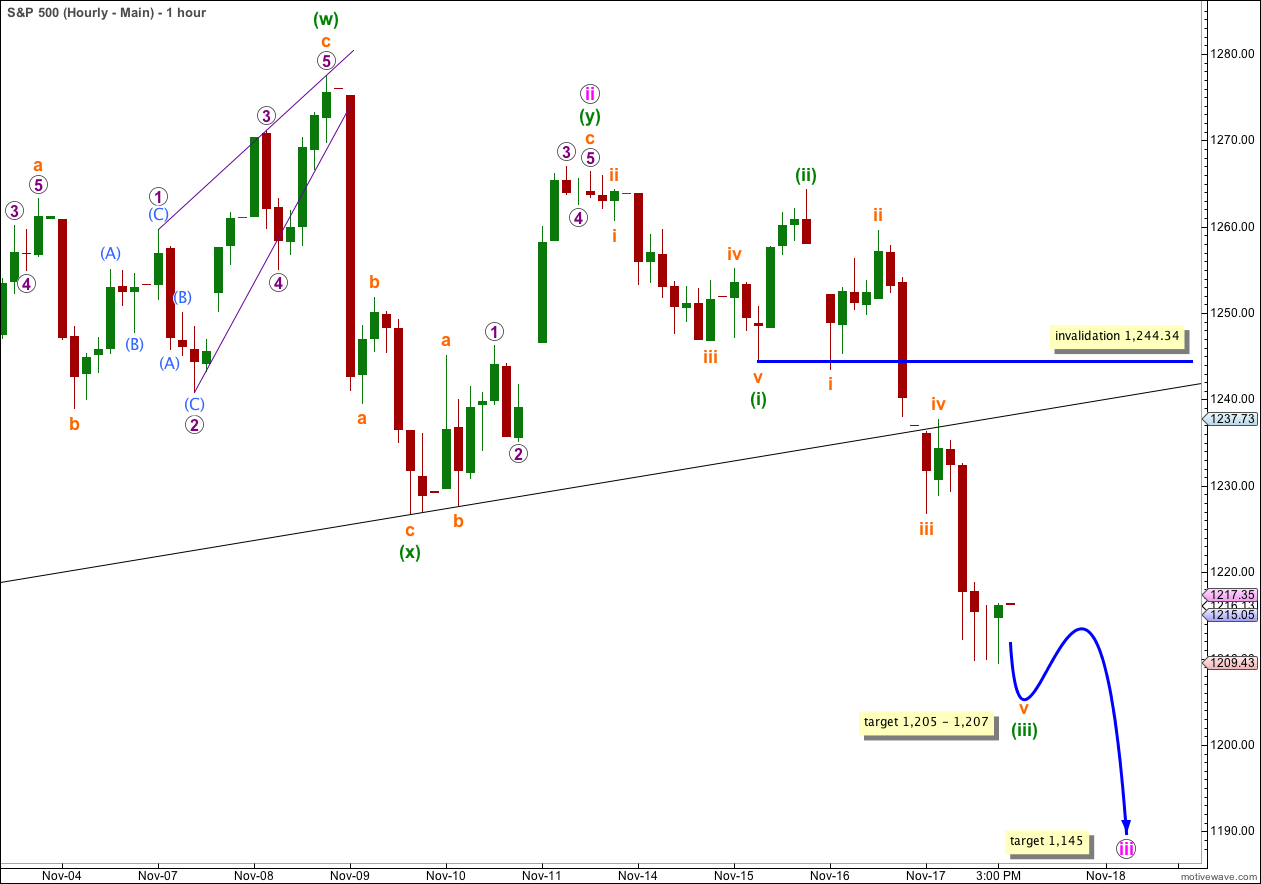
I have drawn in the trend line explained in yesterday’s analysis. Instead of this trend line providing support for downwards movement and initiating a small upwards correction to begin Thursday’s session, this trend line provided resistance for a small correction after price fell below it at the start of the session.
The target for wave iii orange was 1,226. Wave iii orange ended at 1,226.76 and a small fourth wave correction for iv orange began here.
Ratios within wave (i) green are: wave iii orange has no Fibonacci ratio to wave i orange, and wave v orange is just 0.05 points short of 0.618 the length of wave iii orange.
Within wave (iii) green wave iii orange is just 0.69 points short of 1.618 the length of wave i orange. We may not see a Fibonacci ratio between wave v orange and either of i or iii orange. At 1,205 wave v orange would reach equality in length with wave iii orange but this target has a low probability.
Wave (iii) green would reach 2.618 the length of wave (i) green at 1,207.
On the 5 minute chart wave v orange is an almost complete five wave structure as it looks to be within the final fifth wave down. We may see a small amount of downwards movement to begin Friday’s session to complete wave v orange and wave (iii) green.
When wave (iii) green is complete we may expect a shallow fourth wave correction for (iv) green. When wave (iii) green is complete draw a Fibonacci retracement along its length and favour the 0.382 Fibonacci ratio as a target for (iv) green.
Wave (ii) green was a deep 90% correction of wave (i) green and wave (iv) green may be a shallow correction of wave (iii) green. Wave (ii) green was a simple zigzag and wave (iv) green may be a triangle, a flat, or a combination correction. Wave (ii) green was over within one session and we may expect wave (iv) green to be over within one session, and maybe taking all of one session or slightly longer if it is a time consuming triangle or combination correction.
Wave (iv) green may not move into wave (i) green price territory. This wave count is invalidated with movement above 1,244.34.
At 1,145 wave iii pink would reach 1.618 the length of wave i pink. This target may possibly be reached next Thursday, although Fibonacci time relationships are not as reliable as Fibonacci price relationships. This time may be taken as an indication only and does not have a high probability.
Alternate Daily Wave Count.
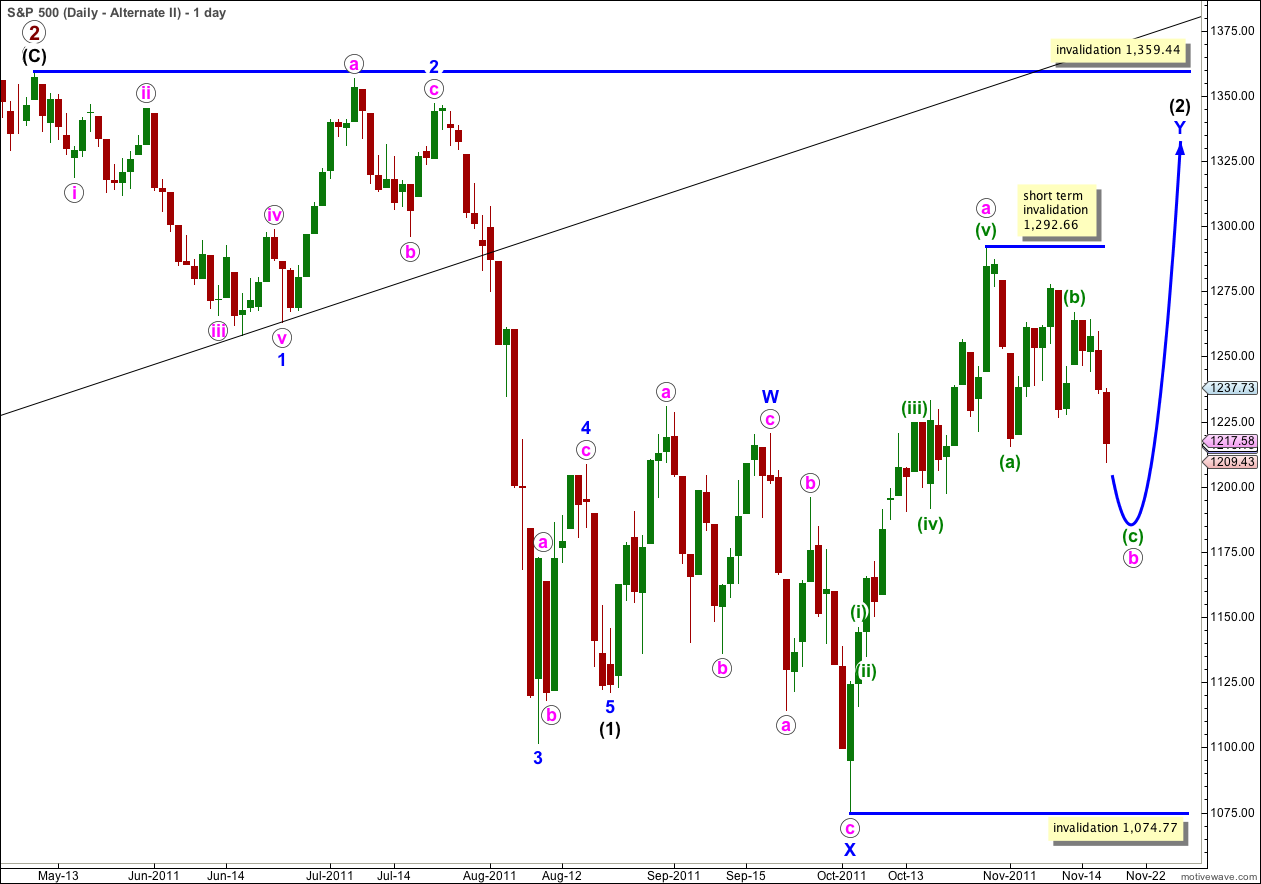
It remains technically possible that wave (2) black is incomplete and we may yet see price move above 1,292.66 in the mid term.
In the short term wave b pink within the zigzag of wave Y blue must complete a three wave structure downwards. This is most likely to make a new low below the end of wave (a) green at 1,215.42 but it does not have to.
Wave (2) black may not move beyond the start of wave (1) black. This wave count is invalidated with movement above 1,359.44.
This wave count does not have as good a look as the main wave count as wave Y blue is significantly out of proportion to wave W blue. However, this only reduces the probability of this wave count and it does not invalidate it.
The subdivisions on the hourly chart are exactly the same as for the main wave count. 1-2-3 and a-b-c have the same subdivisions. The targets and invalidation points for the short term are the same.
FYI, Thursday is a holiday here in the states…
Thank you Michael! Yes, Thanks Giving. We don’t have that here in New Zealand. I was in the States last year and had my first ever Thanks Giving, and it was wonderful!
So if it’s a holiday in the USA the US markets will be closed and there will be nothing for me to analyse, the data I’m using is NY session only data. I’ll put a message to this effect in Wednesday’s analysis.