
Elliott Wave chart analysis for the S&P 500 for 11th November, 2011. Please click on the charts below to enlarge.
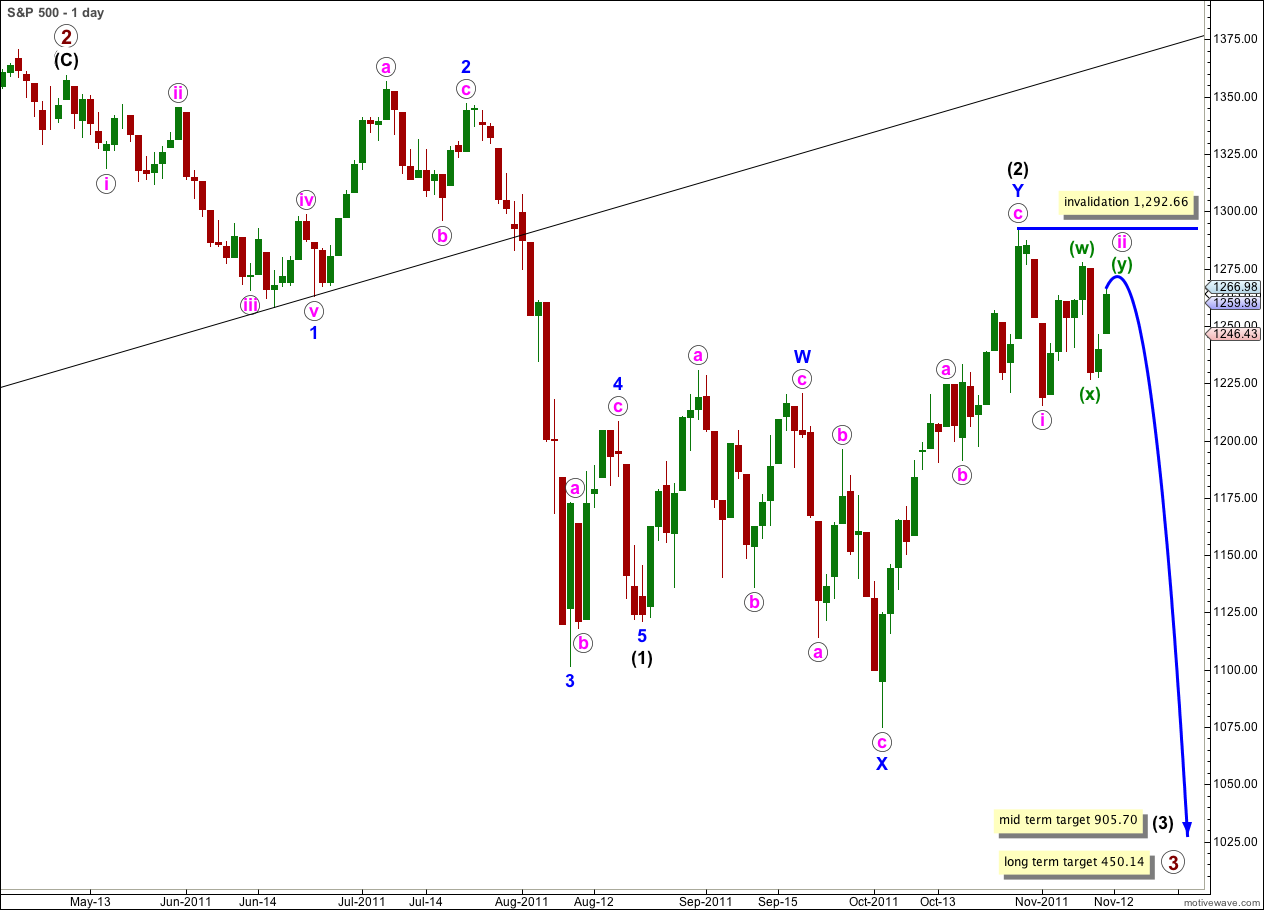
Movement above 1,251.82 invalidated our main hourly wave count confirming an alternate. The correction for wave ii pink is incomplete and wave iii pink downwards has not yet started.
We are seeing yet another double combination or double zigzag correction unfold, as smaller fractal of wave (2) black.
When this second structure within wave ii pink is complete then the probability that wave iii pink downwards should follow will be extremely high. Triple combinations are relatively rare structures, and in comparison doubles are relatively common.
Wave ii pink may not move beyond the start of wave i pink. This wave count is invalidated with movement above 1,292.66.
If this wave count is invalidated with movement above 1,292.66 then we may use the alternate below.
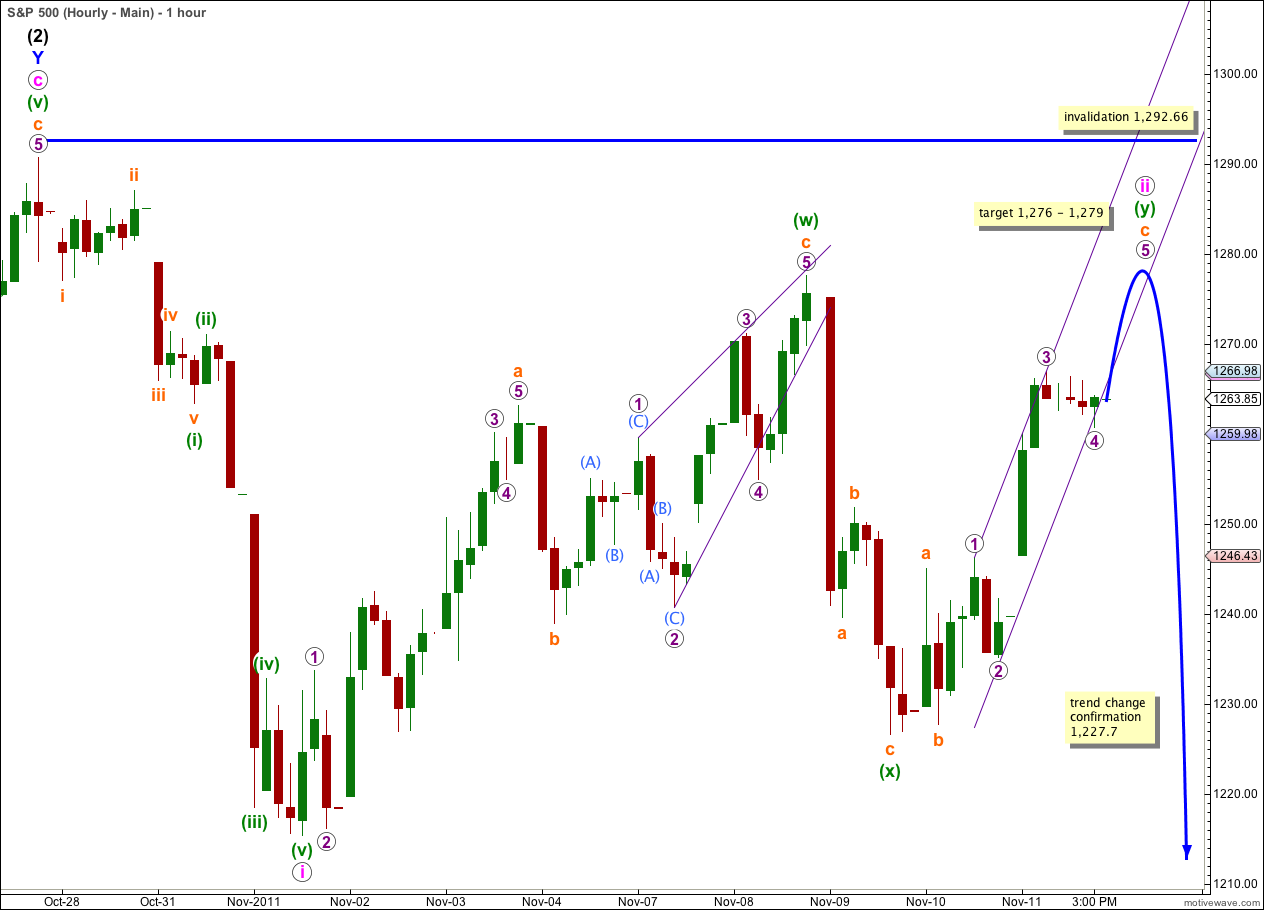
Wave ii pink is now much longer lasting than wave i pink, and is a very deep correction of wave i. Second waves can and often do correct to very deep degrees. Because this is within a first wave at minor (blue) degree we may still see deep second wave corrections and not a sheer drop downwards.
Within wave (w) green zigzag there is no Fibonacci ratio between waves a and c orange.
Within wave (x) green zigzag wave c orange is 1.71 points longer than 0.618 the length of wave a orange.
Within wave (y) green flat correction wave c orange would reach 2.618 the length of wave a orange at 1,276.
Within wave c orange of wave (y) green wave 3 purple is 1.84 points longer than 1.618 the length of wave 1 purple. We may not see a Fibonacci ratio between wave 5 purple and either of 1 or 3 purple. If we did, the most common ratio would be equality with wave 1 purple at 1,279.
We may favour the lower end of the target zone 1,276 – 1,279.
When price moves up for a final fifth wave, and thereafter turns back downwards, we may have confidence that wave c orange and therefore wave (y) green flat correction is over when price moves below 1,227.70. At that point downwards movement may not be just a second wave correction within wave (y) green and wave (y) green would have to be over.
Before this, however, we may see a strong trend channel breach of the small channel containing wave c orange as our first indication of a trend change.
The next downwards movement is extremely likely to be a third wave.
Alternate Wave Count.
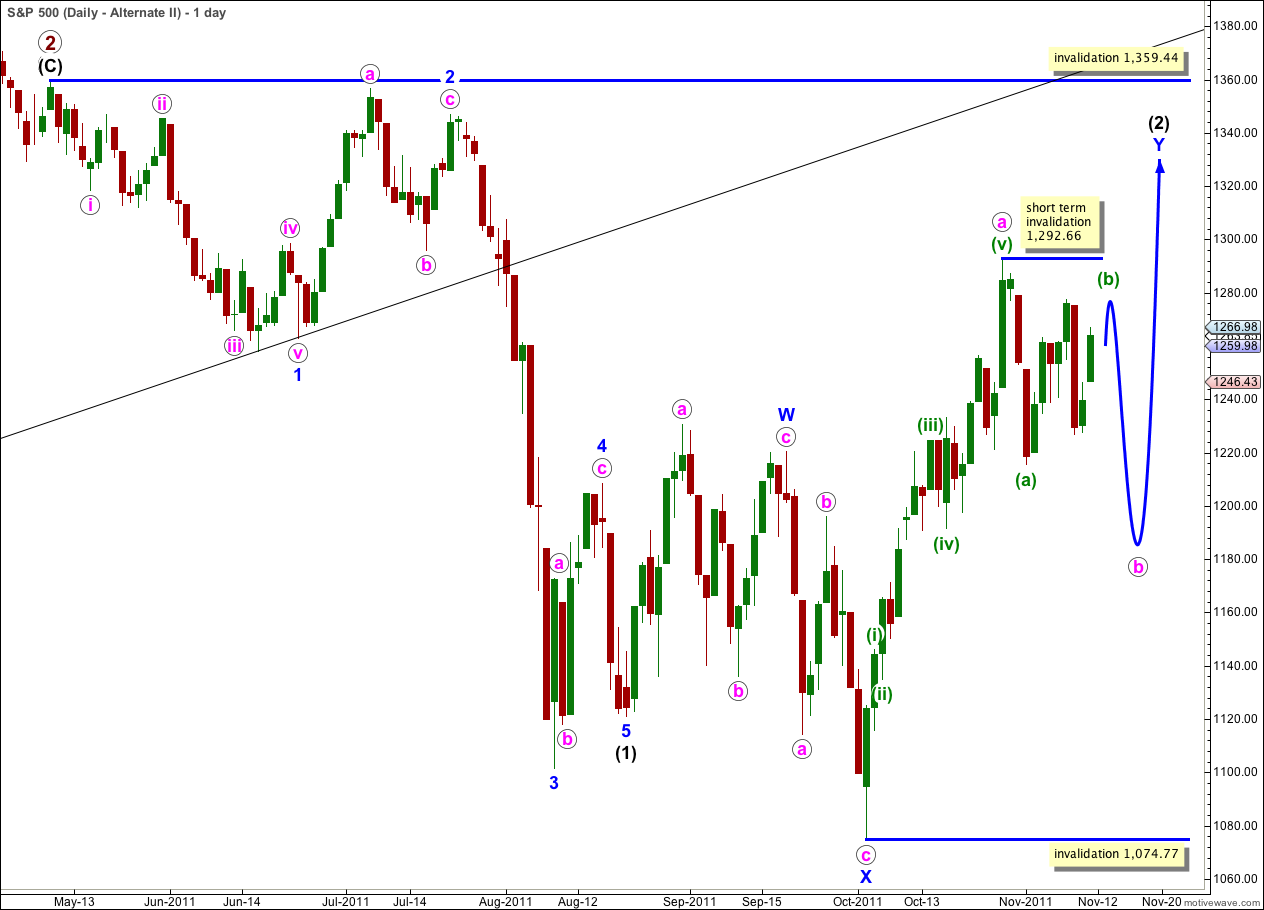
It remains technically possible that wave (2) black is incomplete and we may yet see price move above 1,292.66 in the mid term.
In the short term wave b pink within the zigzag of wave Y blue must complete a three wave structure downwards. This is most likely to make a new low below the end of wave (a) green at 1,215.42 but it does not have to.
Wave (2) black may not move beyond the start of wave (1) black. This wave count is invalidated with movement above 1,359.44.
This wave count does not have as good a look as the main wave count as wave Y blue is significantly out of proportion to wave W blue. However, this only reduces the probability of this wave count and it does not invalidate it.
The subdivisions on the hourly chart are exactly the same as for the main wave count. 1-2-3 and a-b-c have the same subdivisions. The targets and invalidation points are the same.
Thank you Lara!!
John A