
Elliott Wave chart analysis for the S&P 500 for 2nd November, 2011. Please click on the charts below to enlarge.
Yesterday’s analysis expected a little upwards movement to a short term target at 1,234.42, to be followed by downwards movement. Price did move higher but reached 1,242.48, 8.06 points above the target, before turning downwards again. Price has not yet made a new low.
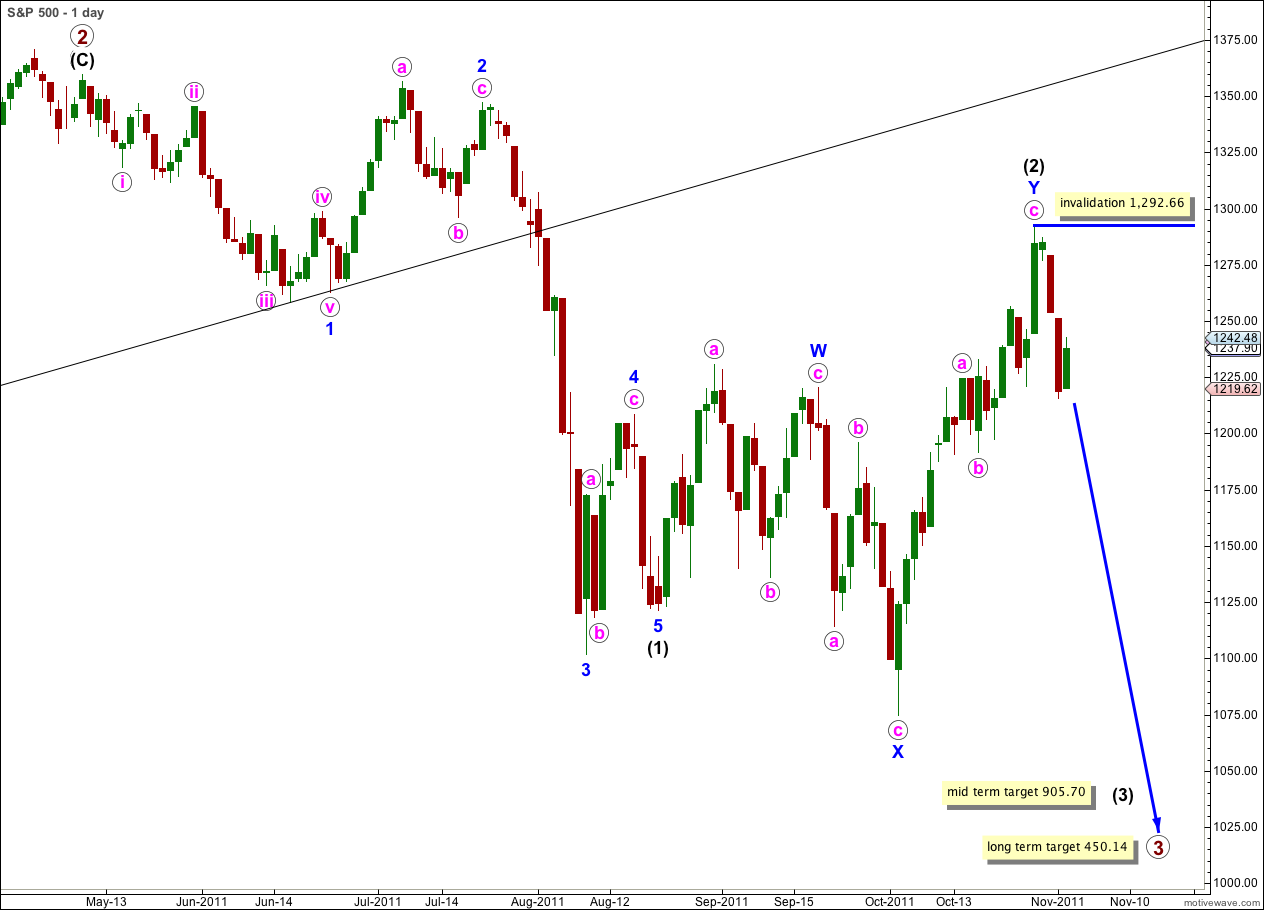
The best wave count which I can see at this stage, where all the subdivisions fit and proportions look good, is our main wave count above which sees black wave (3) within primary wave 3 within cycle wave c as just begun. Another couple of strong downwards days will add confidence to this big trend change.
Although at this stage I am struggling to see a good fitting alternate allowing for further upwards movement within wave (2) black, there is a very slim possibility that wave (2) black may continue yet higher as a triple zigzag structure. The rarity of triple zigzags in the stock market means such a wave count has a very low probability. If price were to move above 1,292.66 that would be the only wave count that I could see at this stage which would explain further upwards movement.
Our targets remain the same. At 905.70 wave (3) black would reach 1.618 the length of wave (1) black. If price were to continue lower past this first target then the next Fibonacci ratio in the sequence is 2.618 the length of wave (1) black which is at 666.54.
Our long term target for primary wave 3 to end is at 450.14 where it would reach equality in length with primary wave 1.
Within wave (3) black no second wave correction may move beyond the start of its first wave. This wave count is invalidated with movement above 1,292.66.
Main Hourly Wave Count.
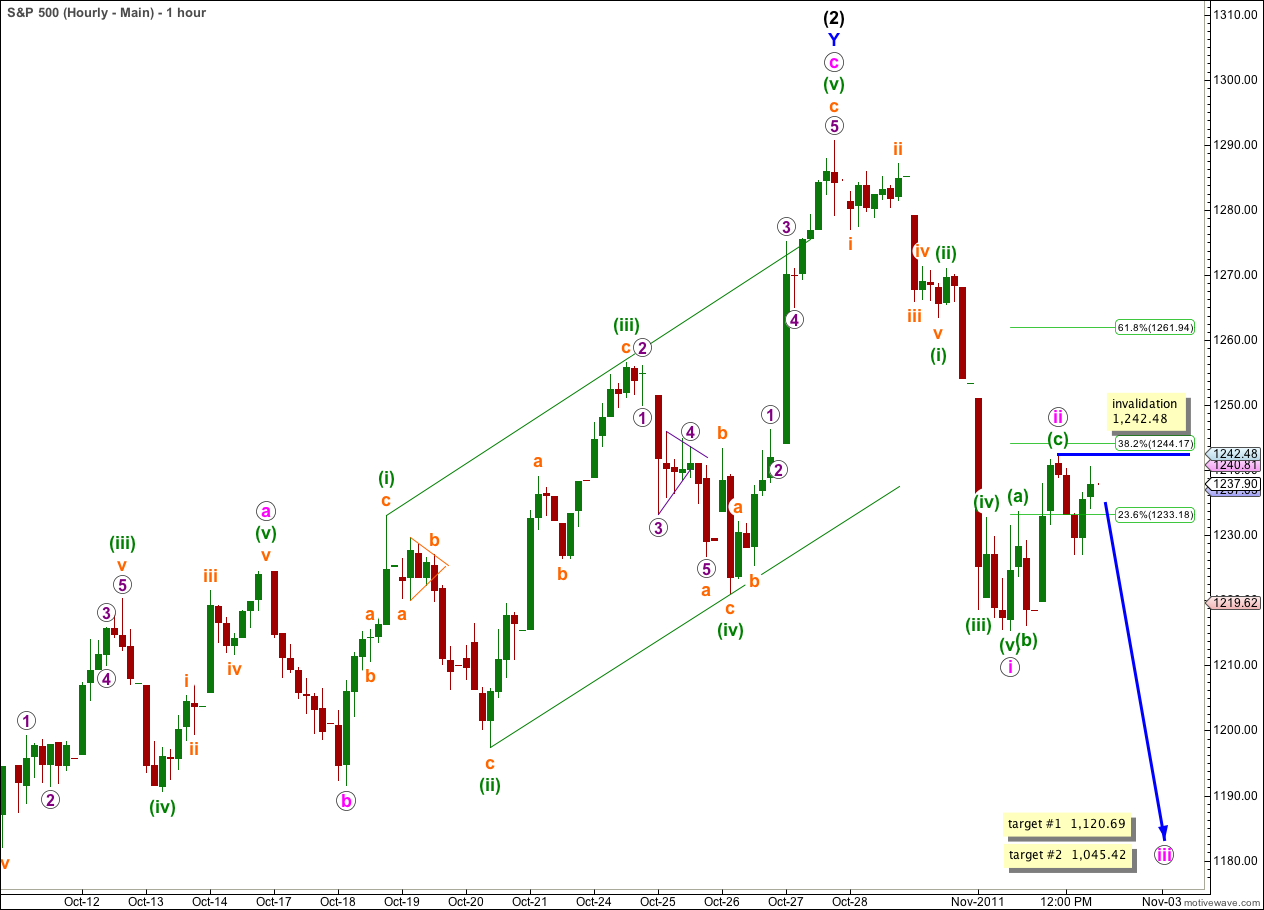
Wave ii pink ended higher, 8.06 points above the short term target we had for it. There is no Fibonacci ratio between waves (a) and (c) green of the flat correction for wave ii pink.
If wave ii pink is now complete then we should not see any further movement above 1,242.48. Wave iii pink downwards should exhibit increasing momentum.
At 1,120.69 wave iii pink would reach 1.618 the length of wave i pink. If price moves through this first target and the structure requires further downwards movement then we shall use the second target. At 1,045.42 wave iii pink would reach 2.618 the length of wave i pink.
If price moves above 1,242.48 tomorrow then we shall use the alternate hourly wave count below.
Alternate Hourly Wave Count.
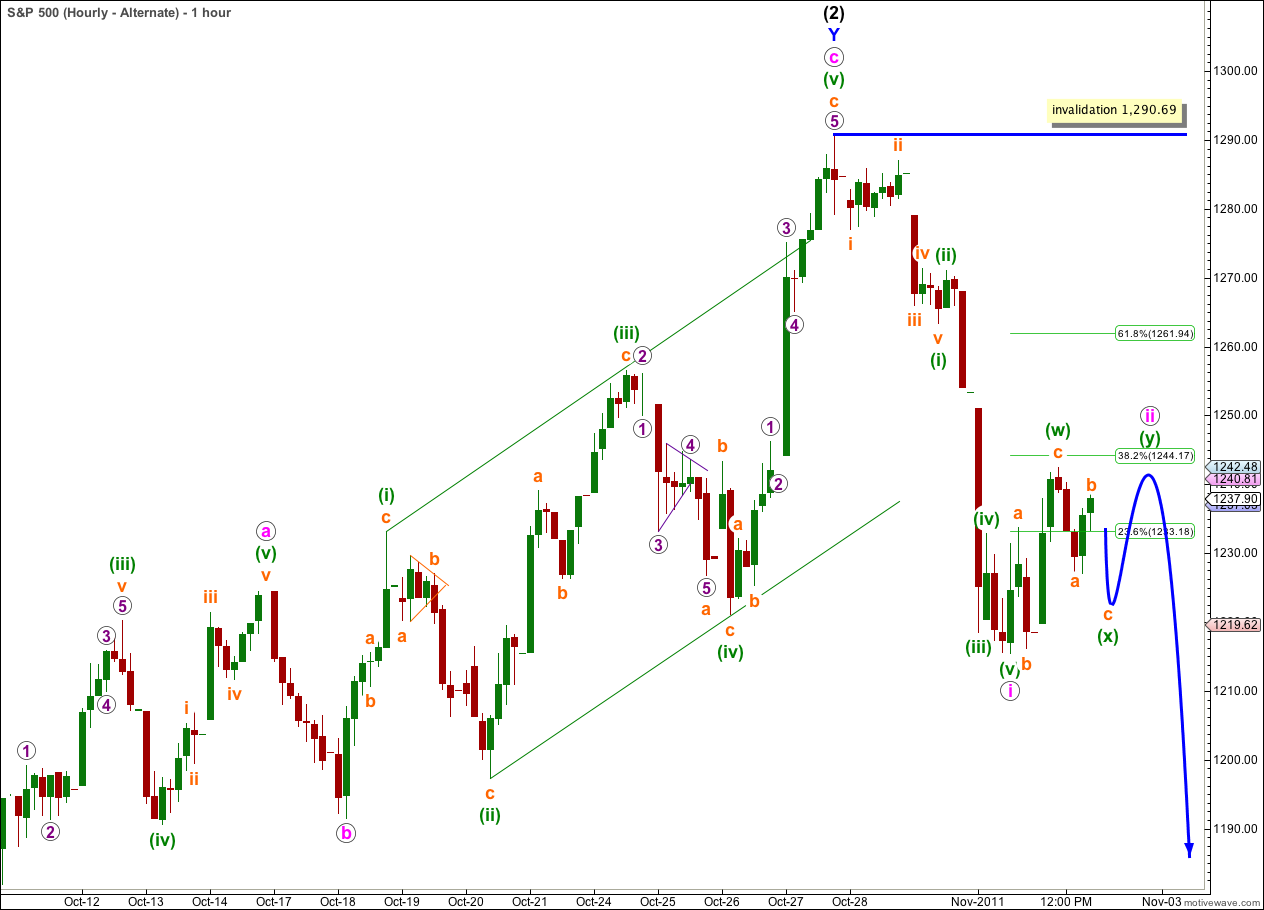
It is possible that wave ii pink is incomplete and may move yet further sideways and higher as a double flat or double combination correction.
The last waves down and up to end Wednesday’s session subdivide on the 5 minute chart into 5-3. This may be 1-2 as for our main wave count, or a-b as for this alternate.
Wave (x) green should subdivide into a zigzag. When the next wave downwards for c orange is complete then movement back into wave a orange price territory would indicate that this alternate is correct. At that stage for our main wave count we would count this recent movement as 1-2-3, and be expecting a fourth wave to remain below wave 1 price territory.
If wave ii pink does continue as a double then it is not as nicely in proportion to wave i pink as the main hourly wave count. For this reason I expect that this alternate has a slightly lower probability than the main hourly wave count.
There are five waves up from 1215 on the SPX that have currently retraced 0.618 of wave 1 pink down. Whilst not a shallow wave 2 correction for a third wave at large degree it would not seem improbable that these five waves up represent wave 2 pink up and that the third of third down may be about to commence.
Yes, except it cannot be a five because 4 would overlap 1. It can be a zigzag, look at the 5 minute chart and you will see that my wave (a) as labeled for today’s analysis is a very nice impulse.
As I’ve stated in today’s analysis I’ve gone back over primary wave 1, and wave (3) black within that. It started off with a couple of sizeable second wave corrections, one of them over 90%!
We are still within a first wave at minor degree, which I don’t think has to see a sheer drop downwards. Blue (minor) wave 3 should for sure though.
Lara,
Unfortunately, your alternate count (now that the main has been invalidated) is looking suspect. Although technically still viable, this upward movement looks too strong.
If we were really about to start a 3 of 3 of C, I think corrections would be far shorter and shallower. I am afraid that perhaps we are looking at quite a bit more upside and that perhaps there is an alternative bullish count that we should be considering.
Peter
I completely agree Peter. These last two days strong upwards movement just don’t fit.
I’m working on an alternate, and I’ll have one for you today, but every alternate idea I consider just does not look quite right.
I also have the much more bullish alternate idea I published a couple of days ago, seeing an extension upwards of primary wave 2 as a double zigzag or double combination.
I’ll keep looking for an alternate idea which has the right look and good proportions. As soon as I see one I’ll publish it.
Thanks. I was also wondering whether it was possible that we are still in intermediate wave 2, with the recent high at 1292 being wave A (Daneric had this count recently). Recent movement down, and now back up would be part of B, which would expect another wave down to complete B, before a final C wave up to complete Intermediate wave 2.
That sounds pretty much like what I’ve come up with. I have to see the rise up from 1,074.77 to 1,292.66 as a five wave structure though, and once I had that then yes it can fit that (2) black is incomplete.
That’s what I’ll be publishing shortly.