
Elliott Wave chart analysis for the S&P 500 for 28th October, 2011. Please click on the charts below to enlarge.
The S&P 500 moved slowly sideways and a little lower in a shallow fourth wave correction during Friday’s session. We should expect further upwards movement before this larger correction for wave (2) black is over.
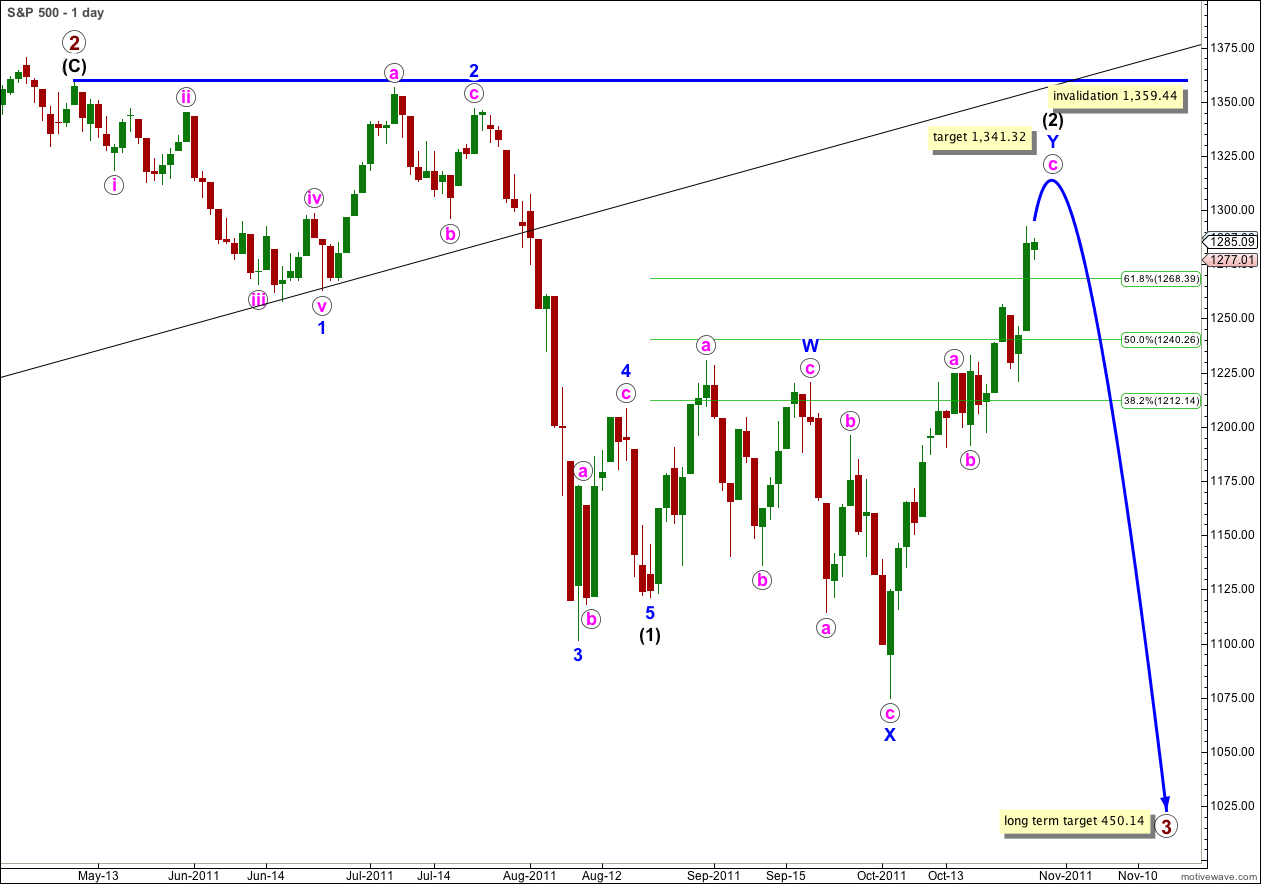
In the larger picture, on monthly charts, downwards movement is impulsive and upwards movement is very clearly corrective. The last upwards wave is a very clear three wave structure which is over. A parallel channel drawn about it shows a very clear trend channel breach.
The only alternate idea that I can see in which primary wave 2 may be still continuing is if it is a double zigzag or double combination structure. If 1,359.44 (and 1,370.58) is breached then we may see price continue much higher. Such a wave count has a very low probability though and at this stage I don’t want to chart it for that reason.
Second waves can and often do correct to very deep degrees. In this case we expected wave (2) black to be relatively shallow because this is within a primary third wave, but it does not have to be. When second waves are very deep corrections they convince us that there has been no trend change, right before a third wave moves price strongly in the opposite direction.
Wave (2) black may not move beyond the start of wave (1) black. This wave count is invalidated with movement above 1,359.44.
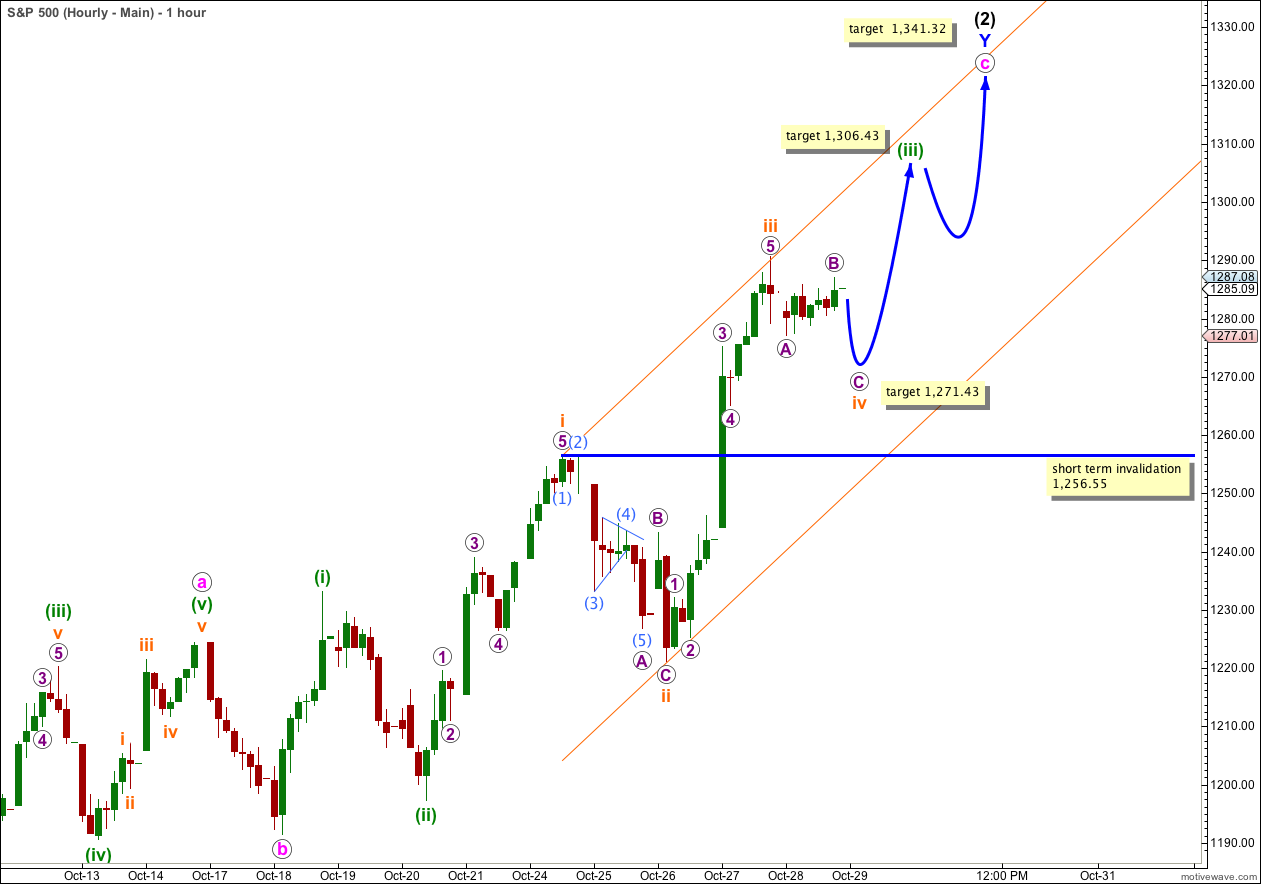
We had expected downwards and sideways movement during Friday’s session for a fourth wave correction. On a 5 minute chart the structure of wave iv orange is incomplete and we should expect further downwards movement before it is over.
At 1,271.43 wave C purple within wave iv orange would reach equality with wave A purple.
Wave iv orange may end mid way in the parallel channel. The following fifth wave to end wave (iii) green should end about the upper edge of the channel.
At 1,306.43 wave (iii) green would reach 2.618 the length of wave (i) green.
Thereafter, we should see another fourth wave correction for wave (iv) green.
A final upwards wave for (v) green would end wave c pink and wave (2) black in its entirety. This structure may take another week before it may again be considered complete.
Wave iv orange may not move into wave i orange price territory. This wave count is invalidated with movement below 1,256.55.
If this wave count is invalidated with downwards movement then wave c pink may be unfolding as an ending expanding diagonal. The invalidation point for that structure is 1,221.06. Below that point wave c pink and wave (2) black would likely be over and a third wave down would be underway.
I have again looked at the possibility that this upwards movement is still part of a C wave for an expanded flat for wave (2) black. Such a wave count has a big problem about the middle of wave C; there is a lot of congestion right were there should be a third wave and it is not possible to see an adequate wave count there which agrees with MACD and avoids running flats.
The one this that keeps bothering me is that the weekly RSI has crossed heading up from a low for 2 weeks now. The last time it did this was in Nov 2009, Dec 2009 and Sept 2010. Any thoughts
Hi Alex,
I don’t use RSI. I’m focussing only on the wave count, and I only sometimes use MACD as an indicator of strength.
As I outlined in the end of week video, the main trend is down because downwards movement is impulsive and upwards movement is in a very clear three wave structure.
So you will have to take my EW analysis and use it as one more piece of information along with your own analysis. If my analysis disagrees with yours then you have a decision to either sit aside until the situation for you becomes clearer, or decide that one or the other has primacy and go with that.