Elliott Wave chart analysis for the S&P 500 for 27th October, 2011. Please click on the charts below to enlarge.
Upwards movement above 1,256.55 invalidated our main wave count and confirmed our alternate. At that stage we expected price to continue higher towards our targets. The first target was met, and exceeded, and this structure now requires further upwards movement to complete it. We will therefore use the second higher target.
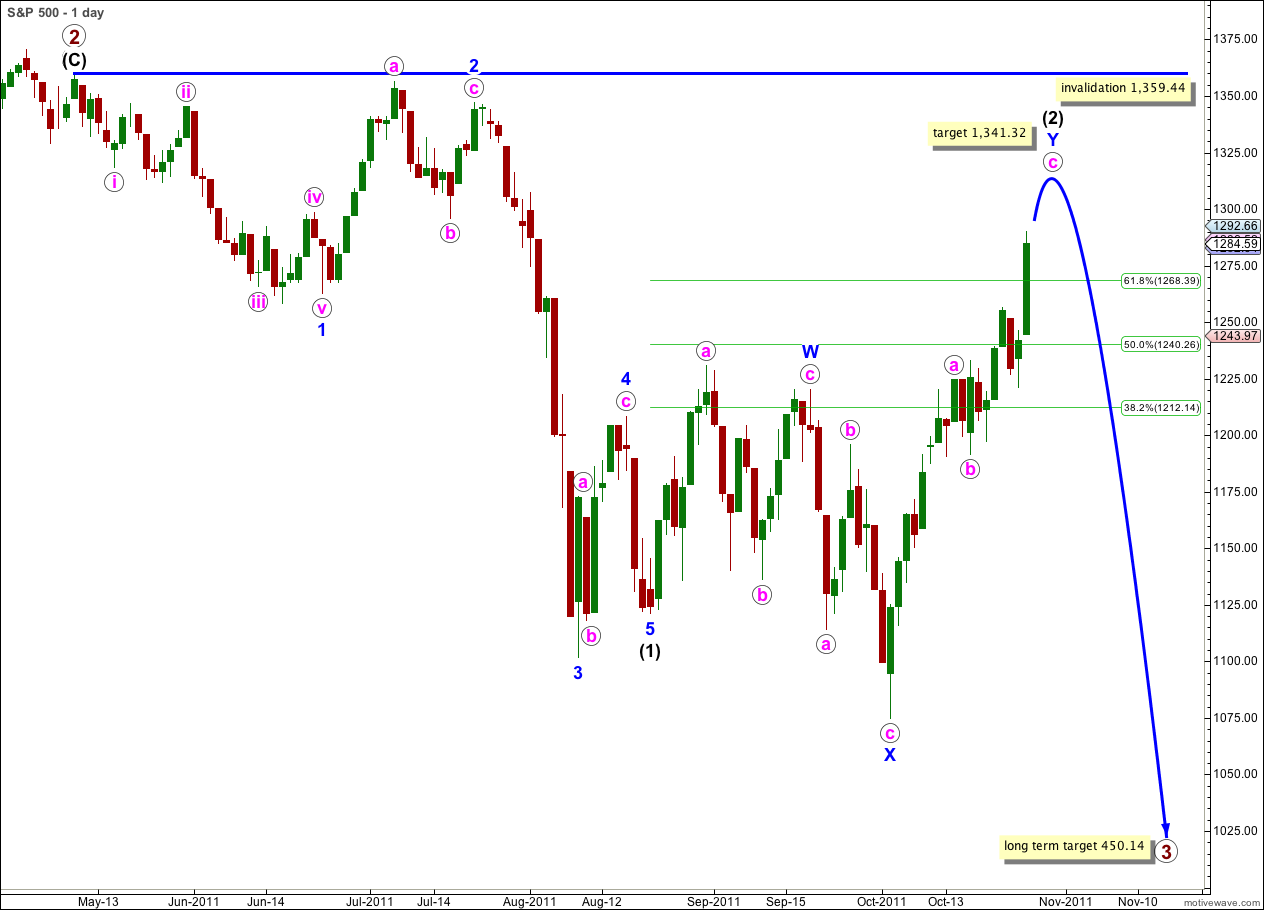
Wave (2) may be unfolding as a double zigzag structure: wave W blue is a zigzag, the two zigzags are joined by a zigzag in the opposite direction labeled X blue, and wave Y blue is a zigzag.
At 1,341.32 wave c pink would reach equality with wave a pink within wave Y blue. This is our target for upwards movement to end.
The end of wave (2) black may be one to two weeks away now.
Wave (2) black may not move beyond the start of wave (1) black. This wave count is invalidated with movement above 1,359.44.
Main Hourly Wave Count.
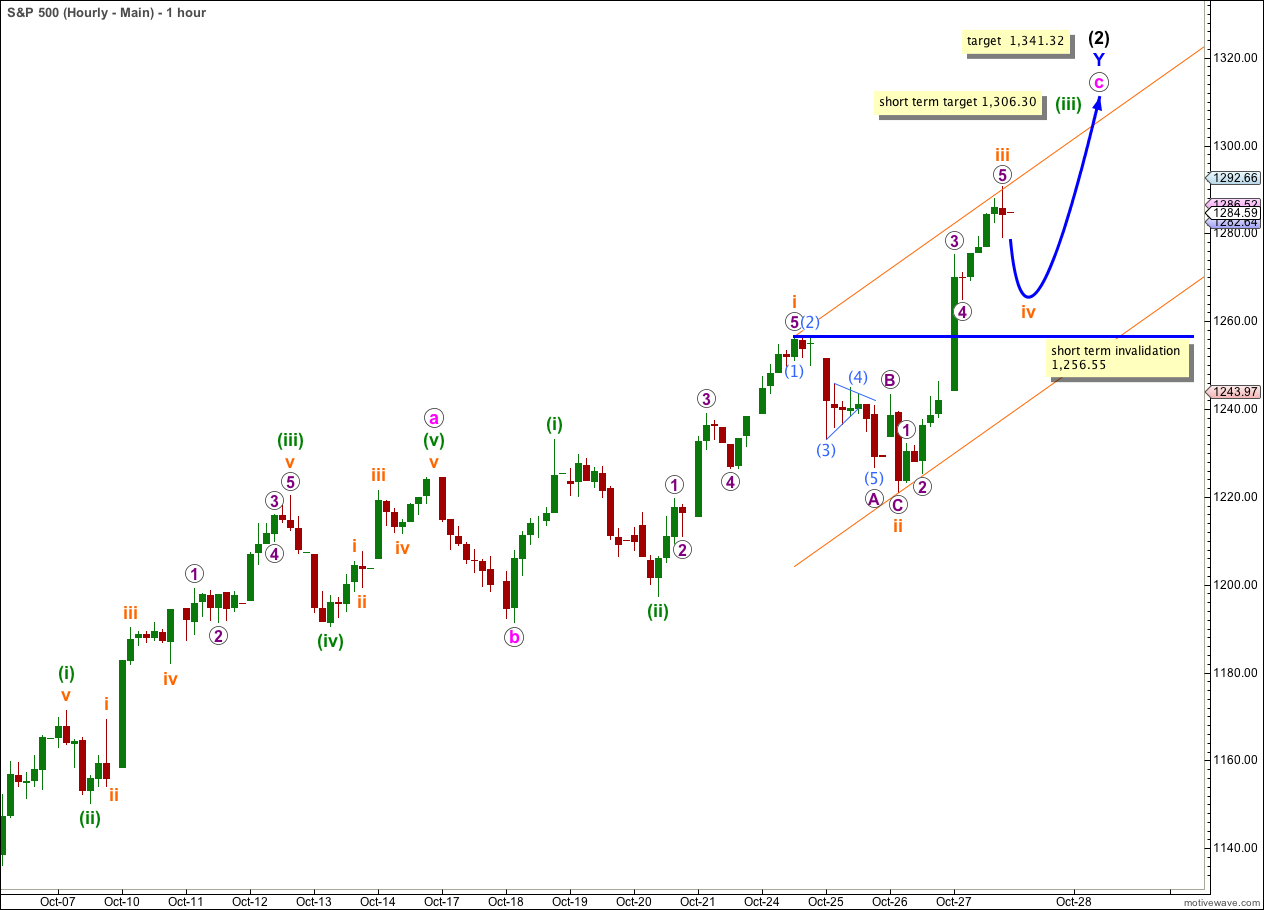
Movement above 1,256.55 indicated that upwards movement was not over, and at that stage we had an initial target at 1,284.08. This target has been reached and exceeded, and the structure is incomplete. We will now use the second target at 1,341.32.
Wave c pink must subdivide into a five wave structure. This may be either an impulse (this main hourly wave count) or an ending diagonal (the alternate).
If wave c pink is unfolding as an impulse then the structure requires further upwards movement to complete it.
Wave iv orange within wave (iii) green should take price lower and may end around about the fourth wave of one lesser degree. Wave 4 purple ends at 1,265.02.
Wave iv orange may not move into the price territory of wave i orange. This hourly wave count is invalidated with movement below 1,256.55.
If this wave count is invalidated with downwards movement then we may use the alternate below.
Wave iv orange should remain within the parallel channel drawn here, and may end mid way in the channel. The following wave v orange to complete wave (iii) green should end about the upper edge of the channel.
When waves (iii) and (iv) green are complete then we may use ratios at green degree to refine the target calculation for wave c pink.
In the short term wave (iii) green would reach 2.618 the length of wave (i) green at 1,306.30. This target may be one to three days away.
Alternate Hourly Wave Count.
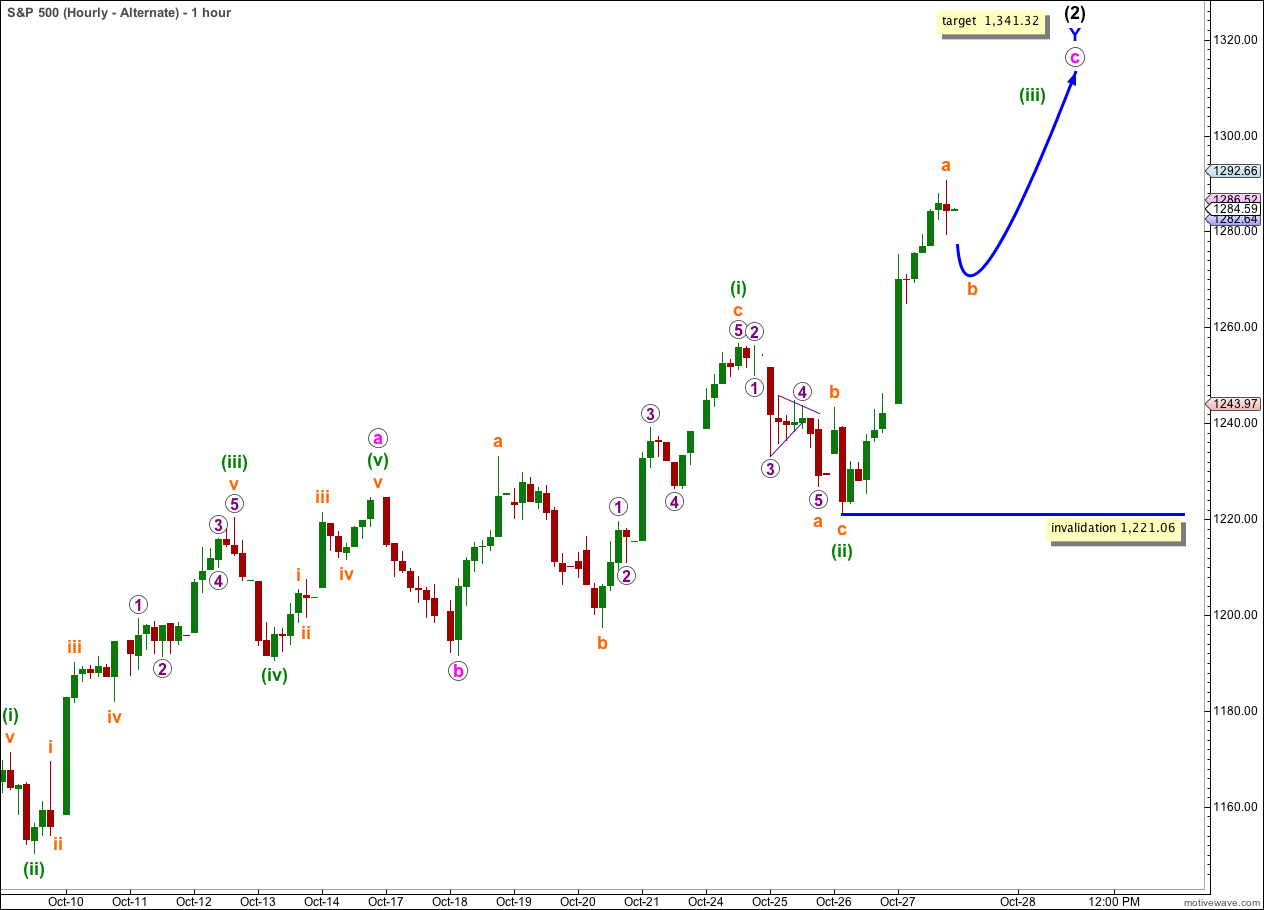
This alternate wave count looks at the possibility that wave c pink is unfolding as an ending diagonal. All subwaves must be zigzags.
The diagonal would be expanding because so far wave a orange within wave (iii) green is longer than wave (i) green.
Wave (iii) green is an incomplete zigzag. Wave a orange has just completed. Wave b orange may not move beyond the start of wave a orange. This wave count is invalidated with movement below 1,221.06.


Lara,
Just wondering if you have an alternate bullish count should 1359 be taken out on the upside. I assume if that were to happen that we would likely be going much higher. Thanks.
Peter
No, I don’t. I could have the invalidation point wrong; it may be at the price high of 1,370.58 rather than at 1,359.44 but that is the only possibility allowing for further upwards movement at this stage, and it’s not much.
The monthly and weekly charts show very clear downwards impulsive movement and upwards corrective movement. Overall the larger longer term trend is down, and the last large upwards correction is complete.
Second waves can and often do correct to very deep degrees. They convince us of a new trend, right before a strong third wave develops in the opposite direction.
Peter, I have considered a possible alternate. The primary wave 2 zigzag could possibly be the first in a double zigzag. I will chart and present this, although the probability is very low indeed.