
Elliott Wave chart analysis for the S&P 500 for 21st October, 2011. Please click on the charts below to enlarge.
Price moved higher during Friday’s session. I had expected that it was most likely to continue to move lower, but had accepted the possibility of one final upwards thrust before the new downwards trend begins. This is what may be happening.
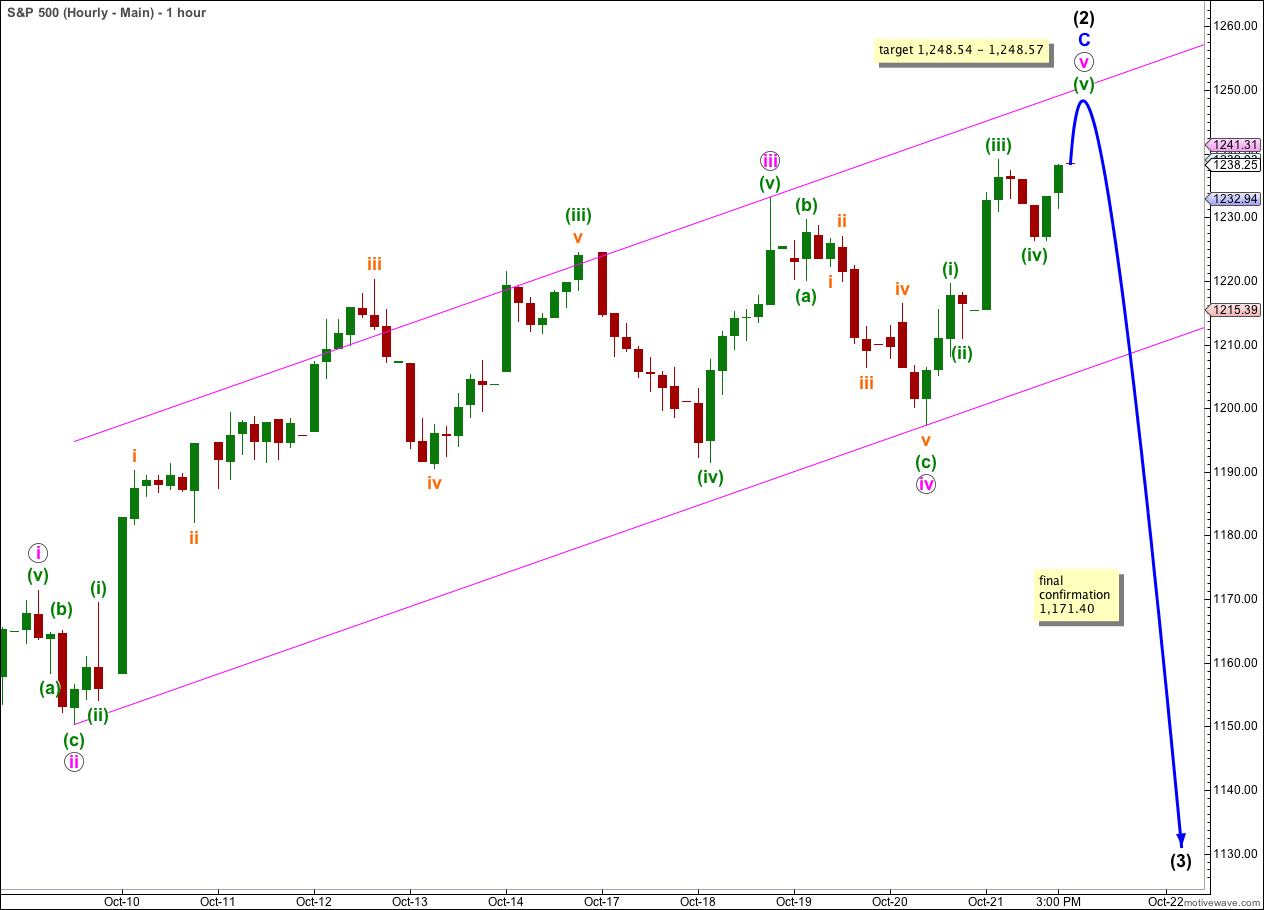
A parallel channel cannot be drawn about an expanded flat correction and we will use the channel about wave C blue on the hourly chart to indicate a trend change. When this channel is breached by downwards movement then we will have some confirmation of a trend change.
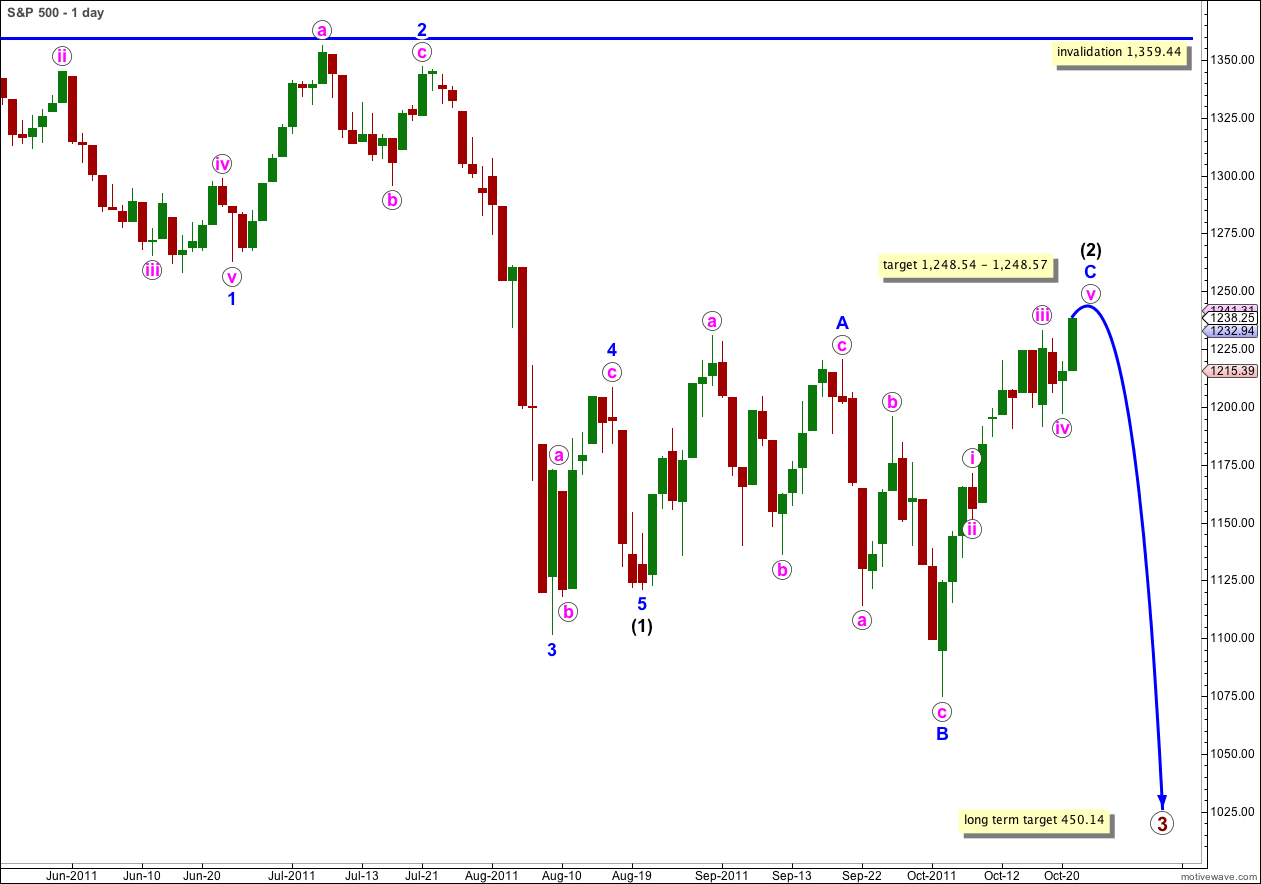
Wave (2) black may not move beyond the start of wave (1) black. This wave count is invalidated with movement above 1,359.44.
I have again adjusted the wave count for the end of iii pink. Wave i pink remains the same.
There is still no Fibonacci ratio between waves iii and i pink.
Ratios within wave iii pink are: wave (iii) green has no Fibonacci ratio to wave (i) green, and wave (v) green is 1.88 points short of 0.618 the length of wave (iii) green.
Ratios within wave (iii) green are: wave iii orange is 1.63 points longer than equality with wave i orange, and wave v orange is 3.36 points short of equality with wave i orange.
At 1,248.54 wave v pink would reach 0.618 the length of wave iii pink.
At 1,248.57 wave (v) green within wave v pink would reach equality with wave (i) green. There is no Fibonacci ratio between waves (iii) and (i) green.
It seems likely that upwards movement is still incomplete. It may take another one to two days before it is over. Price may come to end about the upper edge of this parallel channel.
When the channel is breached by downwards movement then we shall have a strong indication of a trend change.
Movement below 1,171.40 would provide full and final confirmation of a trend change. At that point downwards movement may not be a fourth wave correction and wave C blue would have to be over.
Thanks for the email….
Your upward targets keep getting blown away. Do you not see any count that would see this as wave 1 of much more upward movement
Congrats to the All Blacks!
Thanks John!
All of New Zealand is completely stoked today.
Rugby is our religion down here.