Elliott Wave chart analysis for the S&P 500 for 6th October, 2011. Please click on the charts below to enlarge.
As expected from last analysis the S&P 500 moved higher during Thursday’s session. The S&P 500 is now within the target zone for this upwards movement.
Also, movement above 1,159.61 invalidated our alternate wave count.
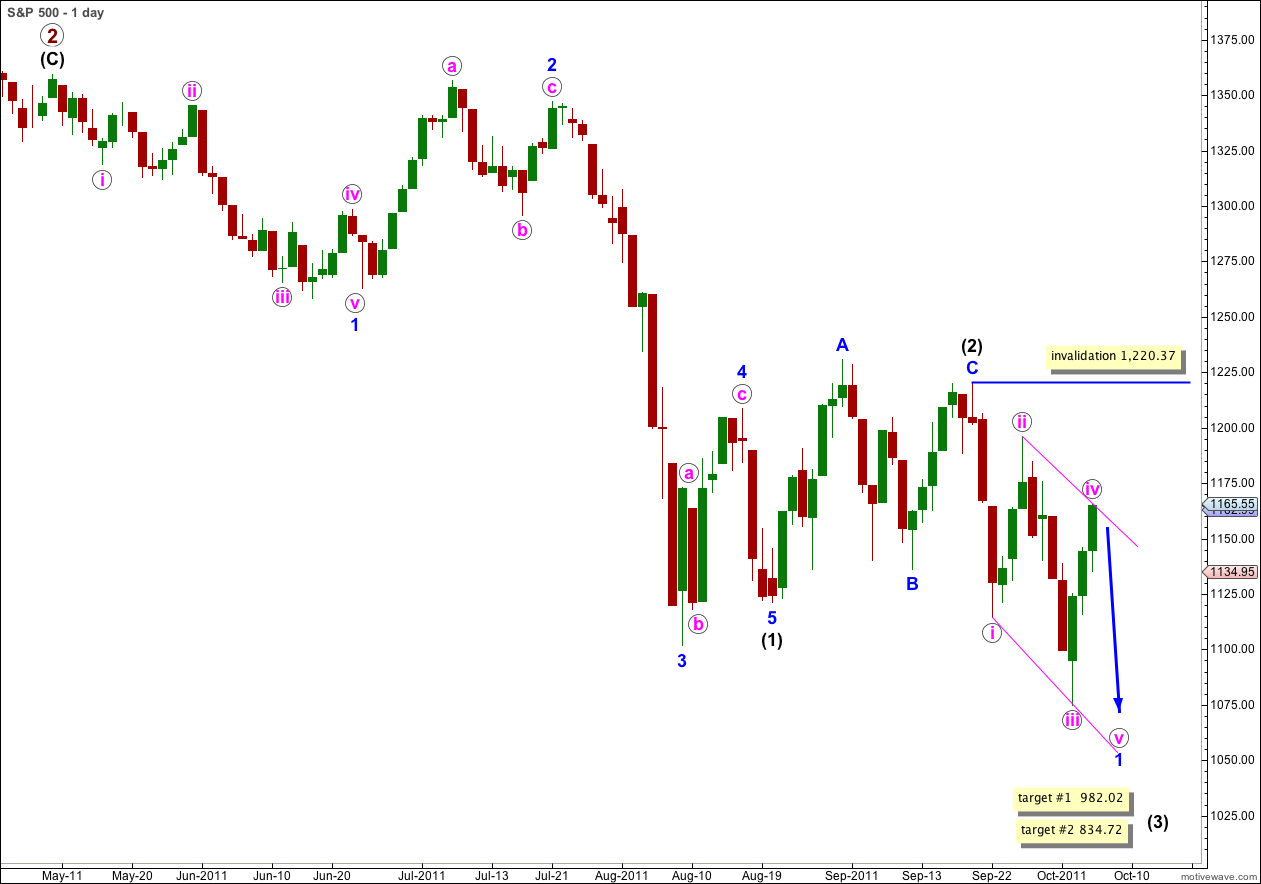
This downwards movement cannot be a series of first and second waves, and at this stage the only structure which fits is a diagonal.
A leading diagonal requires subwaves 2 and 4 to be zigzags, and subwaves 1, 3 and 5 are usually zigzags but may also be impulses.
Wave iii pink is longer than wave i pink, and wave iv pink is now longer than wave ii pink, so the diagonal is expanding. For an expanding diagonal we should expect the fifth wave to fall short of the 1-3 trend line.
When the leading diagonal for wave 1 blue is complete we should expect a deep correction for wave 2 blue up to reach 0.786 the length of wave 1 blue. Thereafter, wave 3 blue down should be strong and extended.
Wave 2 blue may not move beyond the start of wave 1 blue. This wave count is invalidated with movement above 1,220.37.
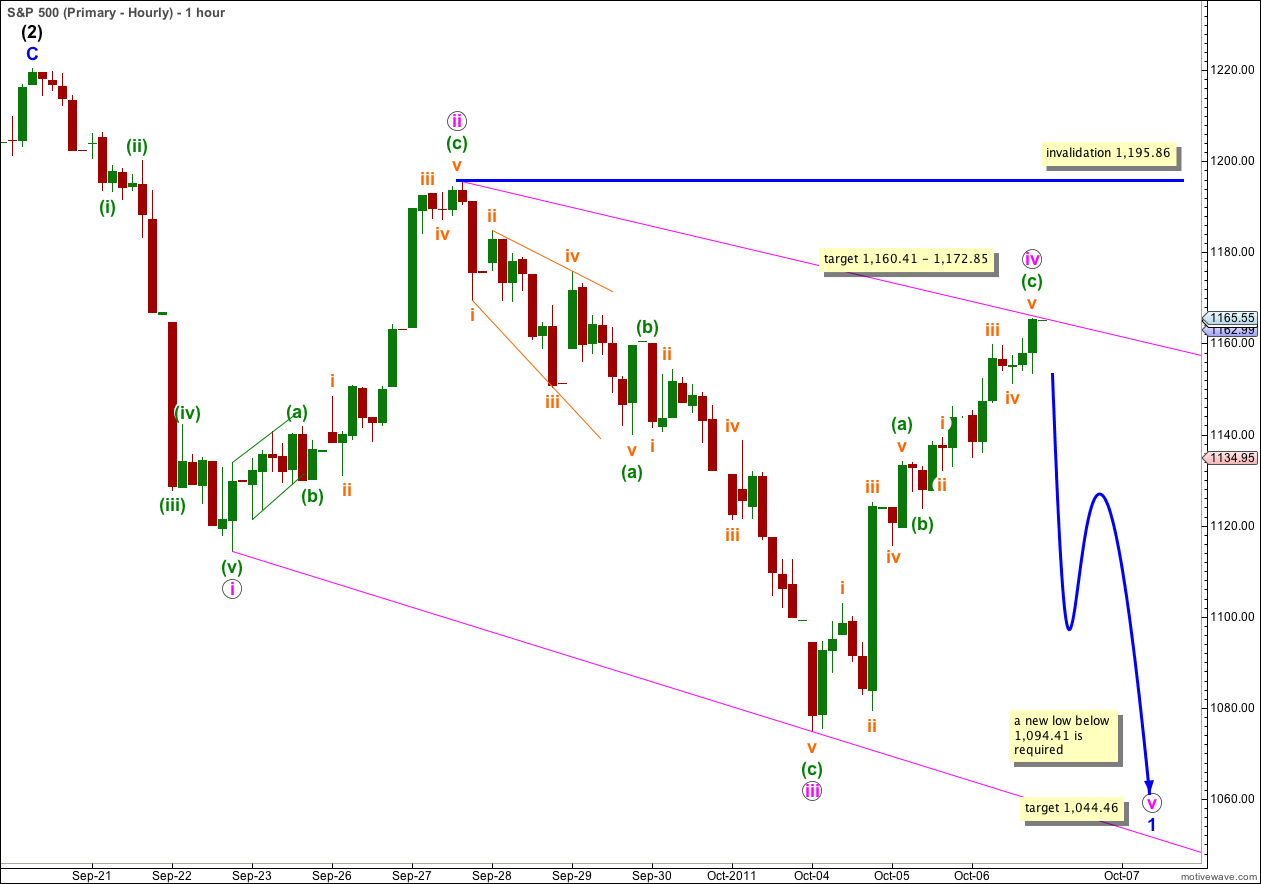
Price is now within our target zone calculated in last analysis and the structure for wave iv pink may be complete.
I have checked the structure of wave iv pink on 5 and 1 minute charts. The final fifth wave within wave (c) green is a complete structure with excellent Fibonacci ratios. If it does extend any higher it should not be by much.
What seems most likely for Friday’s session is downwards movement.
The diagonal is expanding so the fifth wave must be longer than the first wave at least. It should be longer than the third. Wave v pink would each equality with wave iii pink at 1,044.46. This is our target for downwards movement to end, and it is likely that it will be at least reached if not exceeded by a little.
When we have waves (a) and (b) green within wave v pink we may calculate a more accurate target for wave v pink to end.
Wave v pink is most likely to be a zigzag, but it may also be an impulse.
A leading diagonal may not have a truncated fifth wave so price must make a new low below 1,094.41.
Movement below 1,155.07 would indicate that wave iv pink is complete and wave v pink is underway. This is the start of wave v orange within wave (c) green of wave iv pink, and movement below this point indicates that the final fifth wave within wave (c) green is complete.


Not an easy call this 2nd wave at high degree leading into 1st of third wave. Wave behavior in the next movement down will confirm or otherwise whether the leading diagonal analysis is correct. Wave behavior since 1st September can also be interpreted as a series of nested wave two’s and IF the nested wave two scenario plays out the next movement down is likely highly explosive. WBC tracks (sometimes leads) SPX and DJIA and right now looks like a clear wave 2 of 3 at very high degree was finally reached Friday 7 October. This is what prompts my curiosity about wave behavior in the next move down for the US SPX and DJIA (explosive or moderate is the question). WBC certainly looks like it it is primed for wave 3 of 3 down at a very high degree. Very well done your calls on this wave 4/wave 2/wave 1 of 3 down market behaviour over the last 3 months. Some flip flopping here and there (totally understandable) but your open mindedness towards alternative options has provided a fantastic analysis of a very complex wave structure.
Go those KIWI’s!
Andrew
Hi Andrew,
Yes, this has been more choppy and overlapping than I was originally anticipating.
I’ve covered the idea of overlapping first and second waves in the end of week analysis, and we did have this as a wave count until it was invalidated.
I’ll always be ready to flip flop if price action shows my wave count is wrong. There’s no point in holding onto a wave count just for the sake of not wanting to change. Flexibility is really important, as is the ability to admit you’re wrong. It’s not possible for me to always be right!
I’m watching A LOT of rugby at the moment. 6 games last weekend! I’m nervous about the AB’s this weekend, and I’ll cheer on the Boks for Hugo today 🙂 It’s just as well there are no waves here so I’m not conflicted.