
Elliott Wave chart analysis for the S&P 500 for 23rd September, 2011. Please click on the charts below to enlarge.
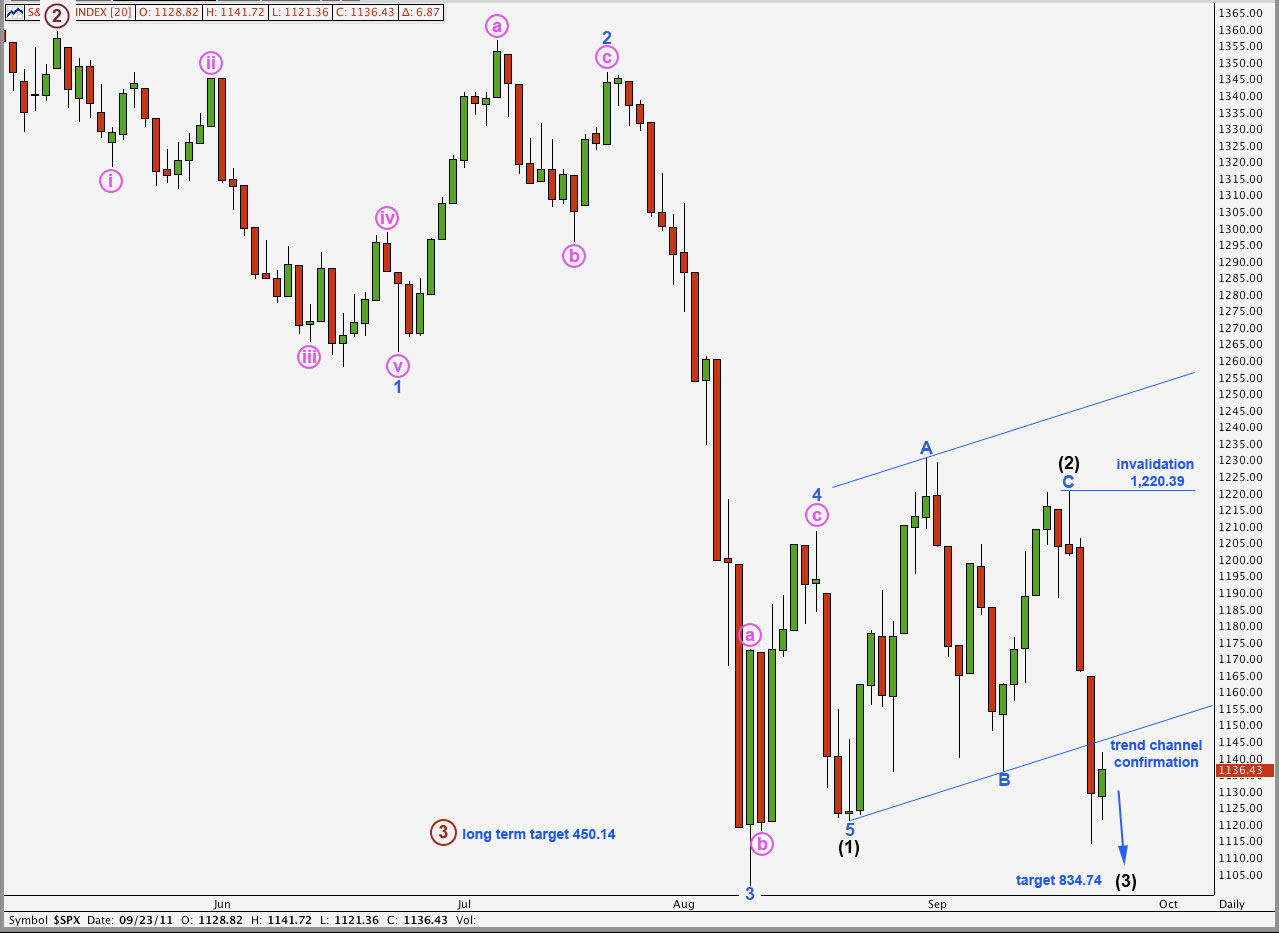
Price moved higher during Friday’s session to end just 0.86 points above our short term target for an upwards correction.
If this wave count is correct then next week should be a very strong down week for the S&P 500.
With a full daily candle now below the parallel channel containing wave (2) black we may be confident that the larger upwards correction is over and the next wave down is underway.
Wave (3) black will reach 1.618 the length of wave (1) black at 834.74.
Within wave (3) black no second wave correction may move beyond the start of the first wave. This wave count is invalidated with movement above 1,220.39.
I am still considering the possibility published here that wave (1) black is incomplete and this downwards movement is wave 5 blue to end wave (1) black. If that was the case I would expect downwards movement to look more like wave 1 blue within wave (1) black, and momentum is clearly greater. Wave behaviour so far does not support this alternate wave count. If momentum does not increase next week we will have to consider this alternate possibility more seriously. For now we should only be aware of it as an unlikely alternate.
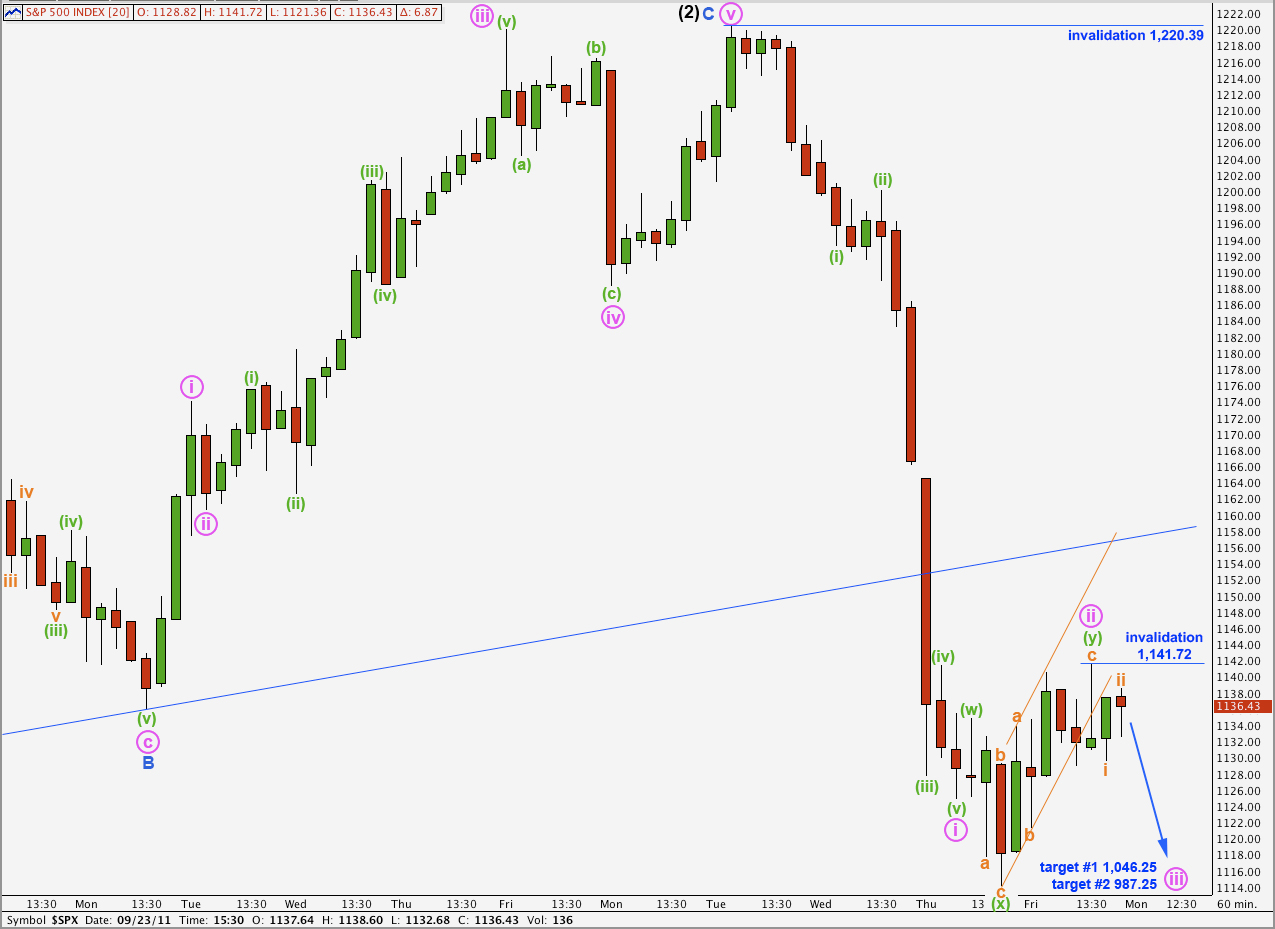
The end of wave i pink and upwards movement labeled ii pink is extremely difficult to analyse. At this stage this labeling has been determined after careful examination of the 5 minute chart, and it is the only labeling which I can see where the subdivisions fit correctly. Wave c orange within wave (y) green looks like an imperfect ending diagonal.
It is possible that my analysis of wave ii pink is incorrect, and it may not quite be over. If it were to continue higher I would expect upwards movement to find strong resistance at the lower edge of the parallel channel containing wave (2) black zigzag, and I would not expect this second wave to be particularly deep nor time consuming. If price moves above 1,141.72 then my analysis of wave ii pink is incorrect. At that stage unfortunately the invalidation point would then lie at 1,220.39 because wave ii pink may not move beyond the start of wave i pink.
Wave ii pink may have been a double zigzag structure. Wave (x) green joining the double is a perfect zigzag where wave c orange is just 1.38 points longer than equality with wave a orange.
Within wave (y) green wave c orange is just 0.67 points longer than equality with wave a orange.
A small channel containing the zigzag for wave (y) green has been breached to the downside. This indicates that the upwards correction is likely to be over and the next wave down should begin.
It is possible that wave ii pink may extend higher as a rare triple zigzag, but the rarity of this structure makes this a very unlikely possibility. Also, within the larger picture this is not a likely place for a triple zigzag to unfold.
Wave iii pink would reach equality with wave i pink at 1,046.25.
Wave iii pink would reach 1.618 the length of wave i pink at 987.25. If this lower target is reached then it is likely that the degree of labeling for this downwards movement should be moved up one degree. We may have seen wave 1 blue within (3) black just end, and wave 3 blue within wave (3) black within primary wave 3 may be just about to start. This would be the strongest downwards fall to occur within this larger movement at cycle degree, it would exhibit huge downwards momentum.
If this wave count at cycle degree is correct then we may expect some changes to regulations surrounding trading. Short selling may become illegal. I would expect to see restrictions around the use of online trading accounts, for US residents, and we may see the US try to enforce restrictions for non US citizens also trading the S&P 500.
I have looked for alternate ideas at cycle degree. I have one idea which sees the S&P 500 as within a double flat correction. This would not expect significantly lower lows below 666.79; it would see mostly sideways movement for another couple of years or so. However, I don’t think wave behaviour supports this idea. Every time we see an actionary wave to the downside of minor degree or above we keep seeing sharp falls. Tthis is evidence of strong downwards pressure on the S&P 500 which continues to show itself.
As an aside, from a Socionomics point of view, I find that right before very strong movements against the common consensus of expected direction is when I receive the most feedback from readers and members telling me why it cannot go down or up. I am again getting more than usual some of this feedback, mainly that people think a bearish outlooks is “crazy”, which gives me a little more confidence in this wave count.
Well I don’t think your crazy Lara 🙂
Ha ha! I tend to think that too, but then if I were crazy it would be unlikely that I’d admit it!
I’m mad over the rugby world cup here at the moment though. Our All Blacks played a spectacular game against France on the weekend, and had a great win. The mood in New Zealand at this time is very happy.