
Elliott Wave chart analysis for the S&P 500 for 20th September, 2011. Please click on the charts below to enlarge.
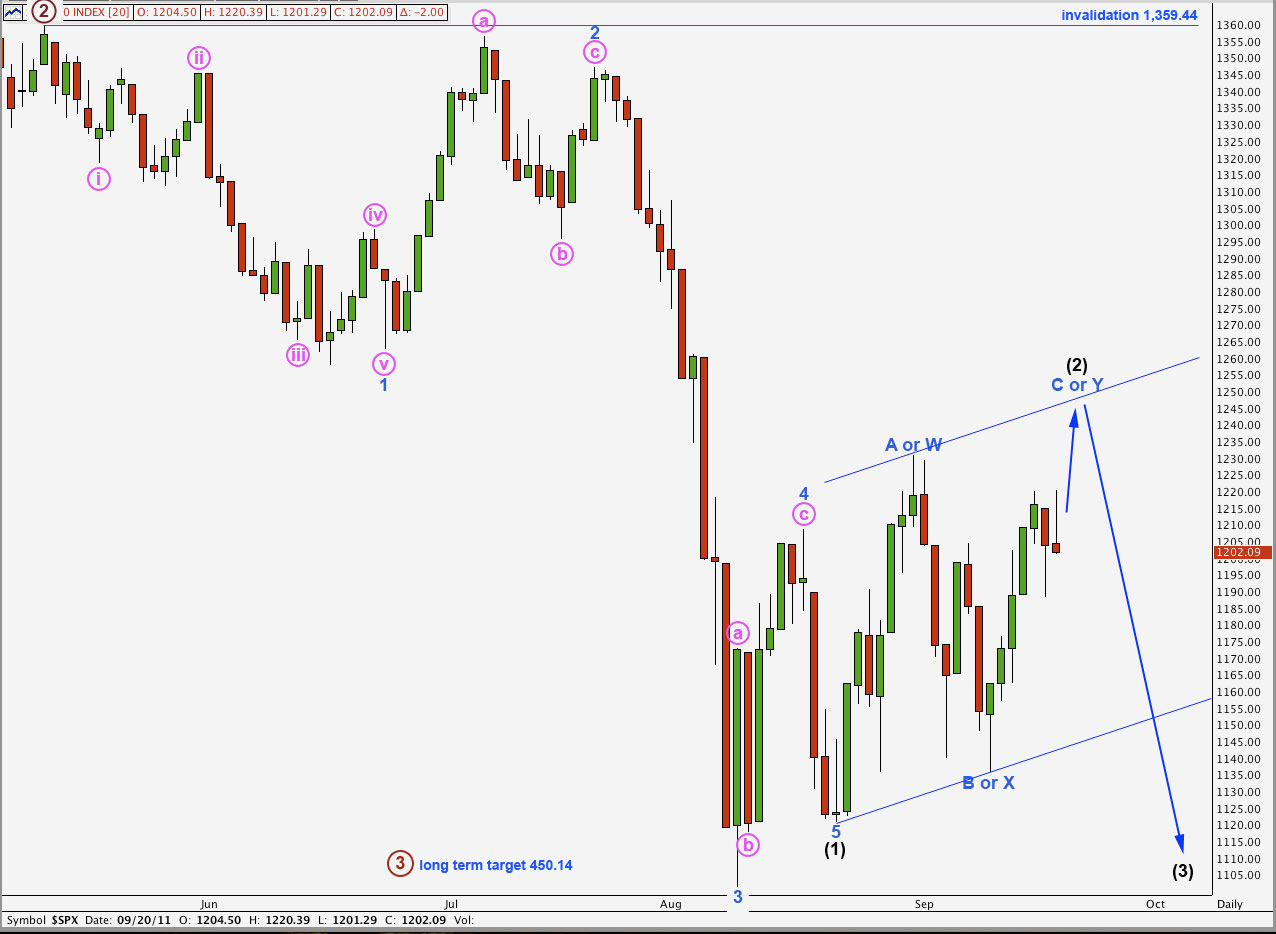
The S&P 500 moved higher to create a new high slightly above the previous high, before turning back down and retracing most of the gains made.
It is possible that upwards movement is over and a third wave for (3) black within primary wave 3 has just begun. Both of our hourly wave counts will look at this possibility today.
It is also possible that we may have one more day of upwards movement before wave (3) black begins, or maybe even two more days. Both our hourly wave counts look at this possibility also.
Movement above 1,230.71 is not required for this wave count; wave C blue of a zigzag for (2) black may be truncated. However, movement above 1,230.71 would provide a lot of confidence in this wave count. At that stage any outlying alternate which saw wave (1) black as incomplete would be invalidated.
It is still possible that we may see upwards movement come to end about the upper edge of this trend channel containing wave (2) black, but this is looking a little less likely today.
Main Hourly Wave Count.
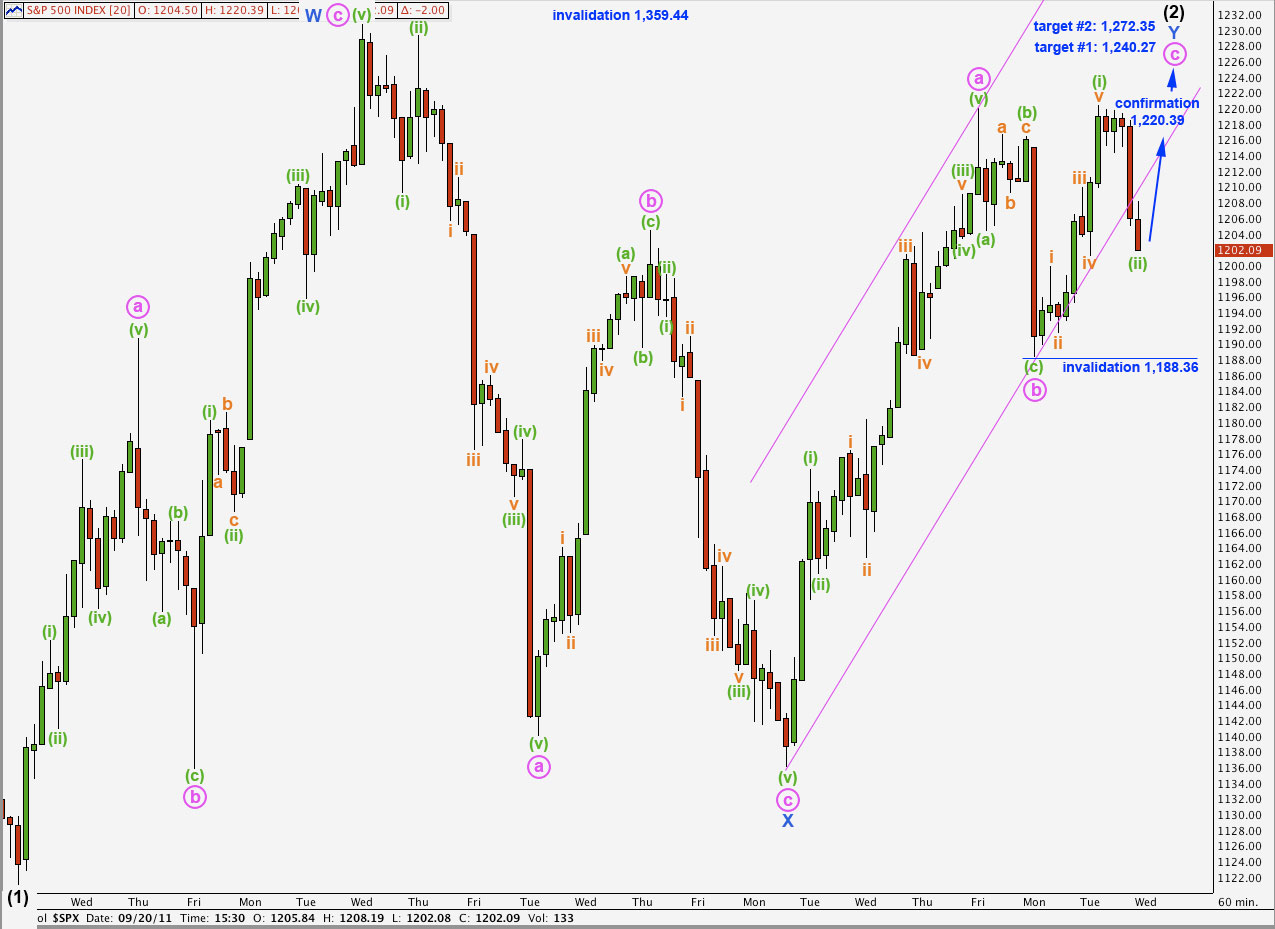
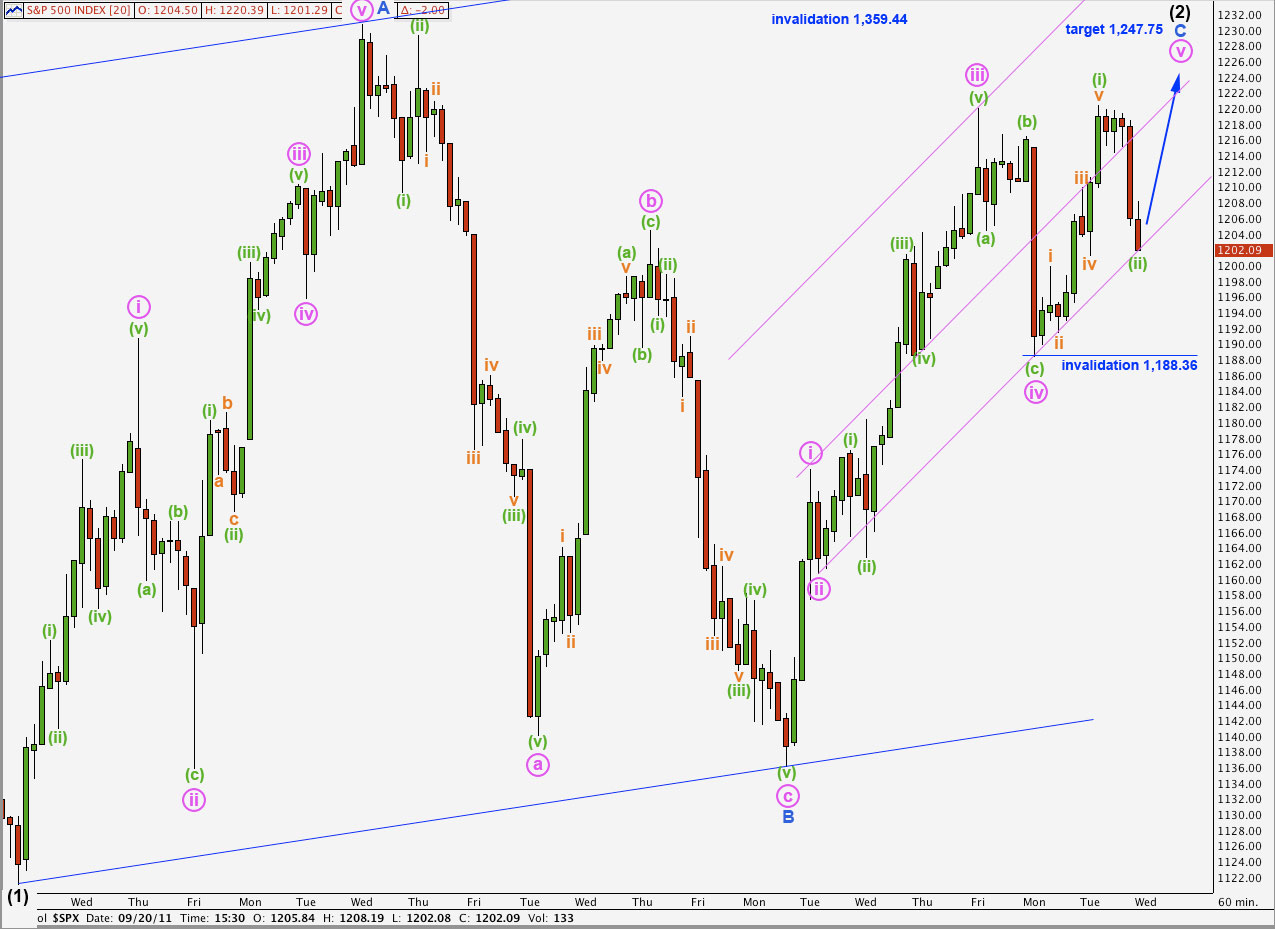
We should always assume that the trend remains the same, until proved otherwise. We should assume that the trend remains upwards for this wave count while price remains above 1,188.36.
Within wave c pink wave (i) green is a perfect five wave impulse. Wave c pink would therefore be unfolding as an impulse, rather than a diagonal which requires all subwaves to be zigzags.
Ratios within wave (i) green of wave c pink are: wave iii orange is just 0.01 short of 1.618 the length of wave i orange, and wave v orange is just 0.6 longer than equality with wave iii orange.
Any further movement of wave (ii) green downwards may not move beyond the start of wave (i) green. This wave count is invalidated with movement below 1,188.36.
Movement to a new high would invalidate the alternate interpretation of this main hourly wave count and so confirm this interpretation. If price moves above 1,220.39 tomorrow then expect it to continue upwards to one of our targets.
The first target is more likely, at 1,240.27 wave c pink would reach 0.618 the length of wave a pink. The second target is less likely, at 1,272.35 wave c pink would reach equality with wave a pink.
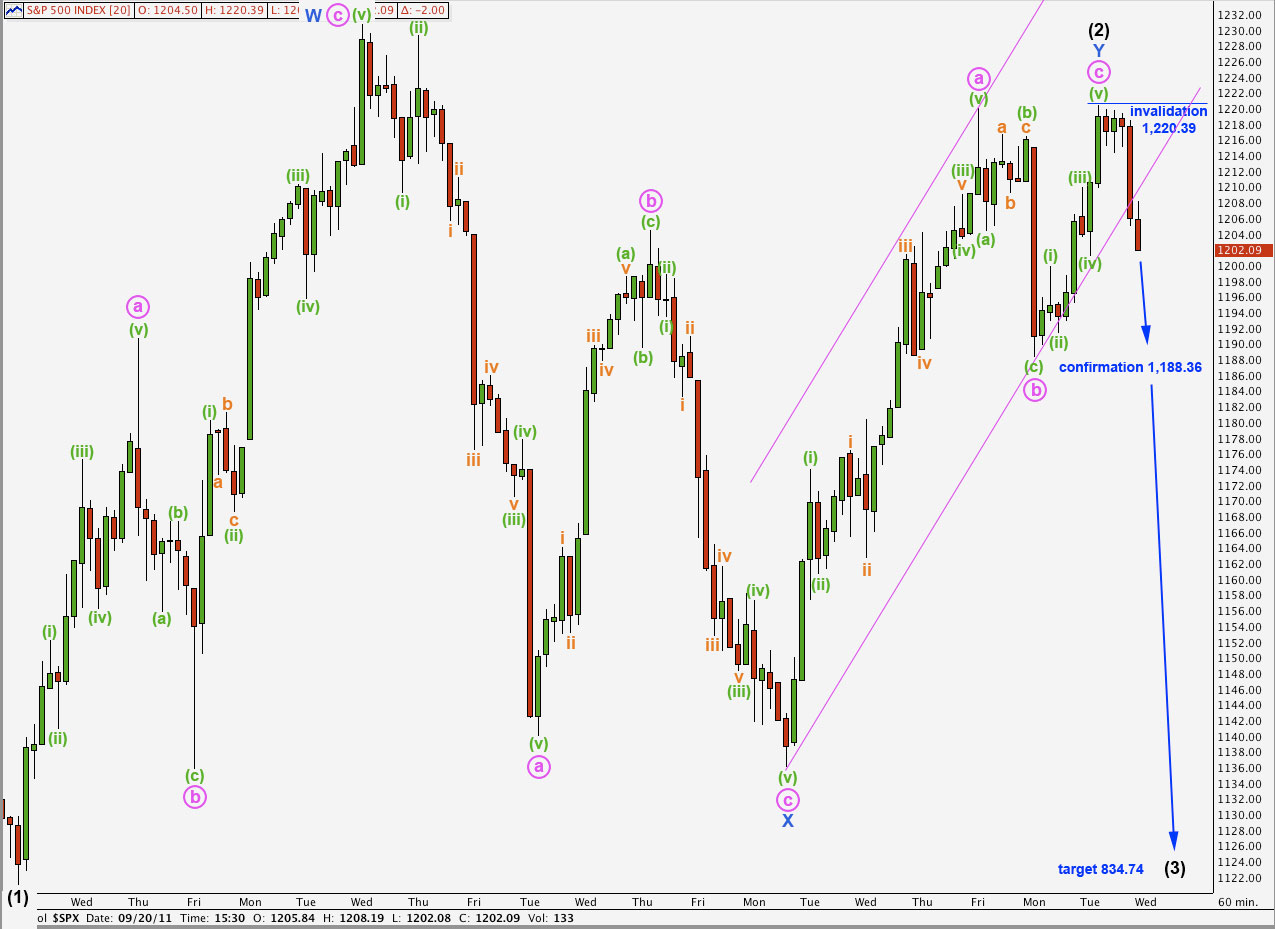
Alternately, wave c pink may be complete as it does have a complete five wave structure. However, wave Y blue has not moved beyond the high of wave W blue and so this double zigzag structure has failed to meet its primary purpose which is to deepen a correction. This failure gives this wave count a strange and unlikely look.
Wave c pink is just 0.05 short of 0.382 the length of wave a pink and it has just managed to avoid a truncation.
We do have a full hourly candle below the parallel channel containing the zigzag for wave Y blue upwards. This may be an early indication that the zigzag is over and the next wave down is underway.
The implications of this are important. If we see downwards movement below 1,188.36 tomorrow then this wave count will be confirmed. If wave behaviour exhibits very strong downwards momentum then it may be the third wave we have been waiting for. At 834.74 wave (3) black would reach 1.618 the length of wave (1) black.
We would need to see expected wave behaviour as well as movement below 1,188.36 to confirm downwards movement as a third wave. When it gets here it should be unmistakeable. If we are unsure then it probably is not the third wave.
Alternate Hourly Wave Count.
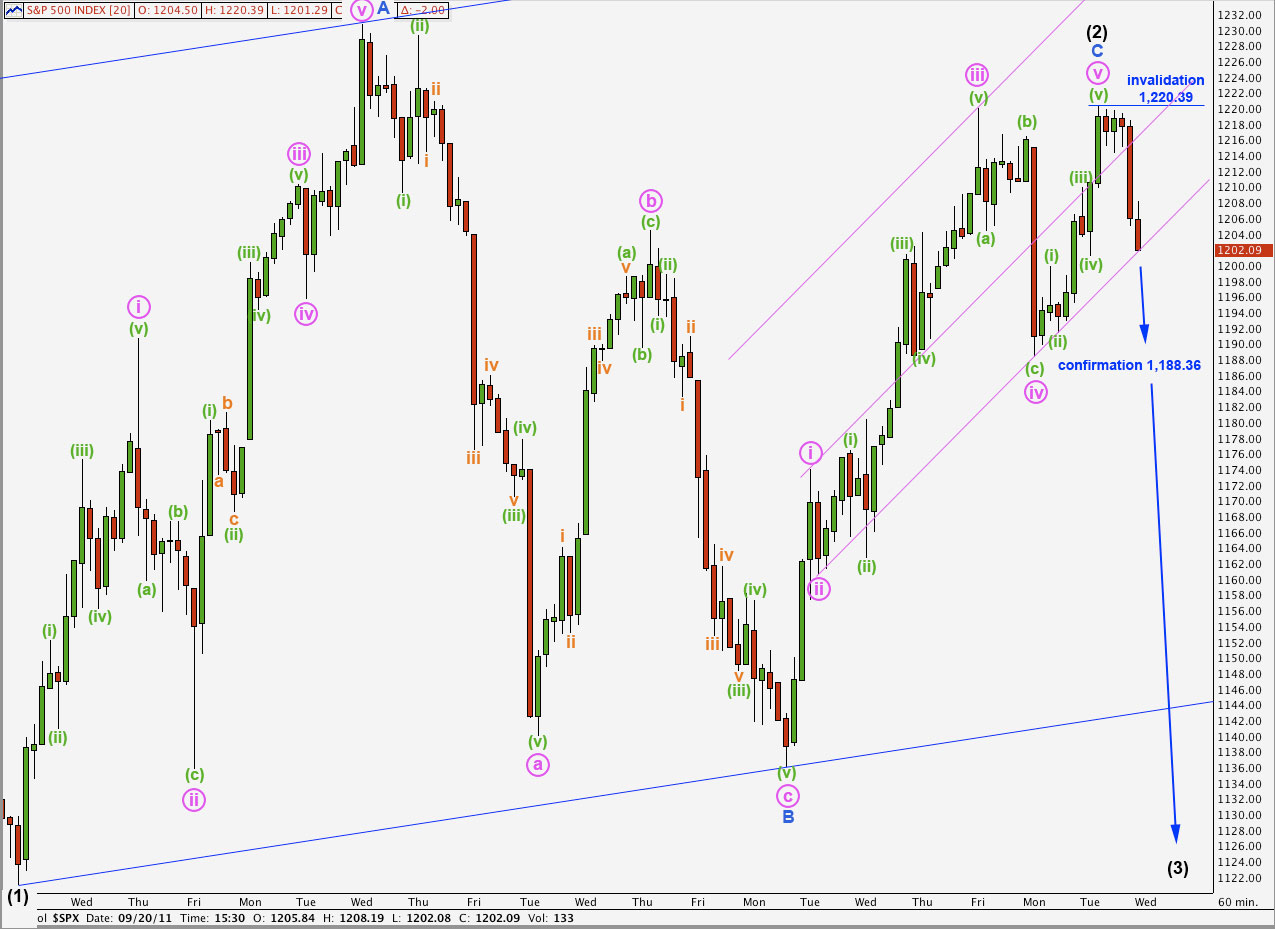
If wave (2) black is a single simple zigzag structure then it is fairly likely that it is over already. For this alternate hourly wave count this interpretation is more likely.
Ratios within wave C blue are: pink wave iii is 2.06 points short of 1.618 the length of wave i pink, and wave v pink has no Fibonacci ratio to either of i or iii pink.
Movement below 1,188.36 would confirm an end to wave C blue and so see wave (2) black as most likely over. Again, wave behaviour is important and if downwards movement exhibits very strong momentum then it would be likely to be a third wave.
Here wave C blue is slightly truncated. This is less problematic than the main wave count having a double zigzag which failed to deepen the correction. A truncation for a C wave of a zigzag may be easily explained if downwards pressure is very strong.
Alternately, upwards movement within wave v pink may be only wave (i) green of wave v pink.
The second target remains the same, and the first target from yesterday does not allow enough room for movement for this wave count anymore.
At 1,247.75 wave v pink would reach equality in length with wave iii pink.
Movement below 1,188.36 would invalidate this wave count.
Thanks for charting that…with this whole movement over the last 2 months being such a mess, we were just entertaining all possibilities.
Thanks!
(we were glad to see that count invalidated though!)
Lara, with 1888 invalidated, is there any way to see this downwards movement as a completion of b pink of blue Y?
The easiest way to count that idea would be to see wave b pink as an expanded flat and the last upwards wave would be (b) green within that. That upwards wave is a perfect five wave impulse, we cannot count is as a B wave. So that does not work.
We could see upwards movement to the high at 1,220.39 as wave a pink complete there. Then downwards movement could be wave b pink from that high.
I think I have to chart this possibility, it’s viable even if it does not have quite the right look.