
Elliott Wave chart analysis for the S&P 500 for 15th September, 2011. Please click on the charts below to enlarge.
Yesterday our main hourly wave count expected upwards movement, which is what we have from the S&P 500 for Thursday’s session. The targets were not reached and this structure remains incomplete.
We have three hourly wave counts today and they now diverge in our expectations for the next movement. They are published in order of probability.
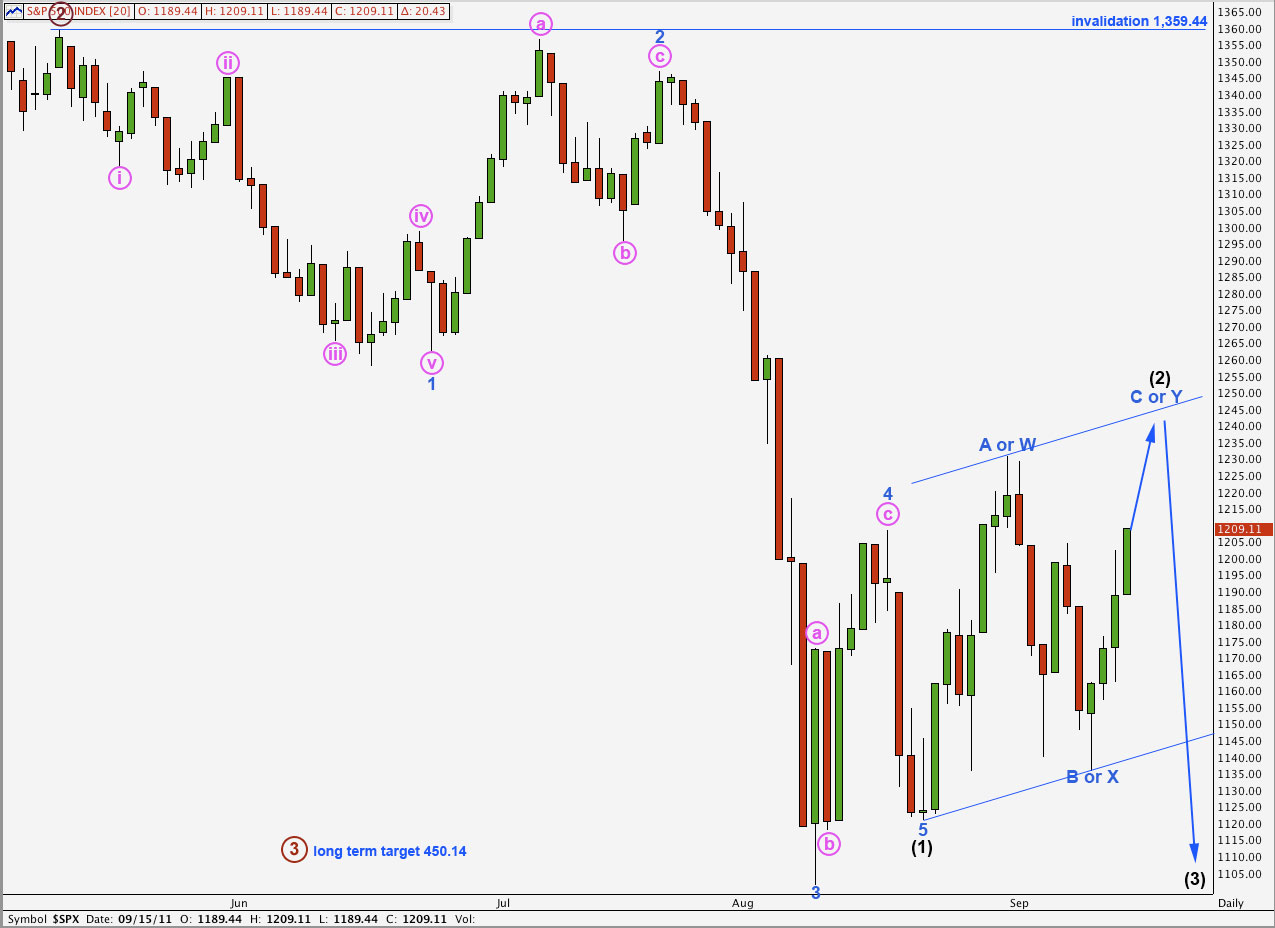
When wave (2) black is complete we shall expect strong violent movement to the downside for wave (3) black. When we have an end to wave (2) black confirmed we may calculate a target for wave (3) black as it would be premature to do so today.
Further upwards movement for wave (2) black to complete is expected for two of our three hourly wave counts today. Wave (2) black may not move beyond the start of wave (1) black. This wave count is invalidated with movement above 1,359.44.
Main Hourly Wave Count.
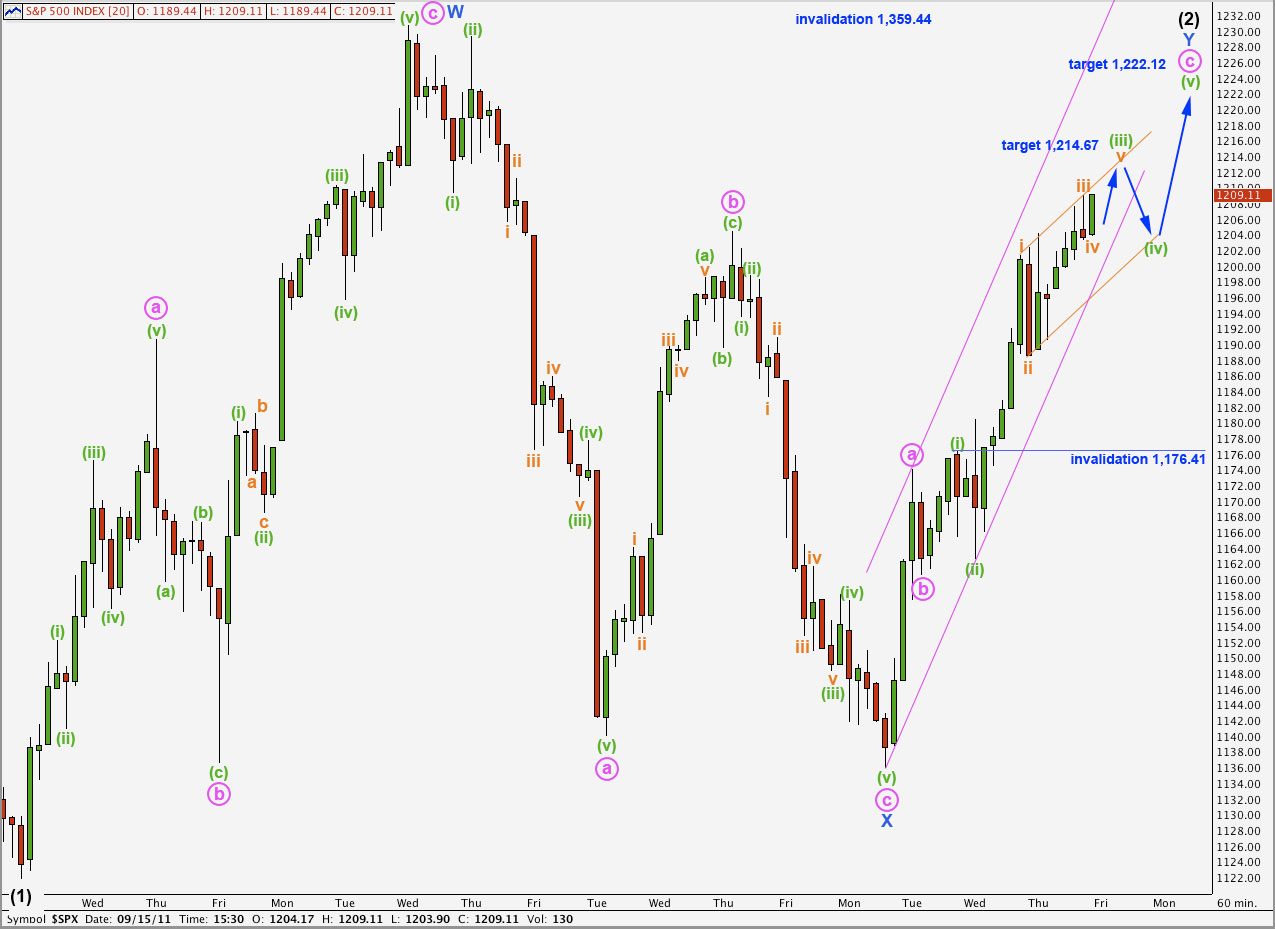
We should always assume that the trend remains the same, until proven otherwise. At this stage the trend is up and we have no confirmation that it has changed. We should assume more upwards movement.
This most likely wave count sees wave (2) black as a double zigzag structure. Wave Y blue, the second zigzag in the double, is incomplete.
Within wave Y blue wave c pink is completing. Wave c pink within wave v orange within (iii) green would reach 0.618 the length of wave iii orange at 1,214.67. This would end wave (iii) green within wave c pink. Wave (iv) green to follow may not move into the price territory of wave (i) green. This wave count is invalidated in the short term with movement below 1,176.41.
Following wave (iv) green a final upwards wave for (v) green would complete this structure at all wave degrees. At that stage we would remove the lower short term invalidation point and expect strong downwards movement for a third wave.
Alternate Hourly Wave Count.
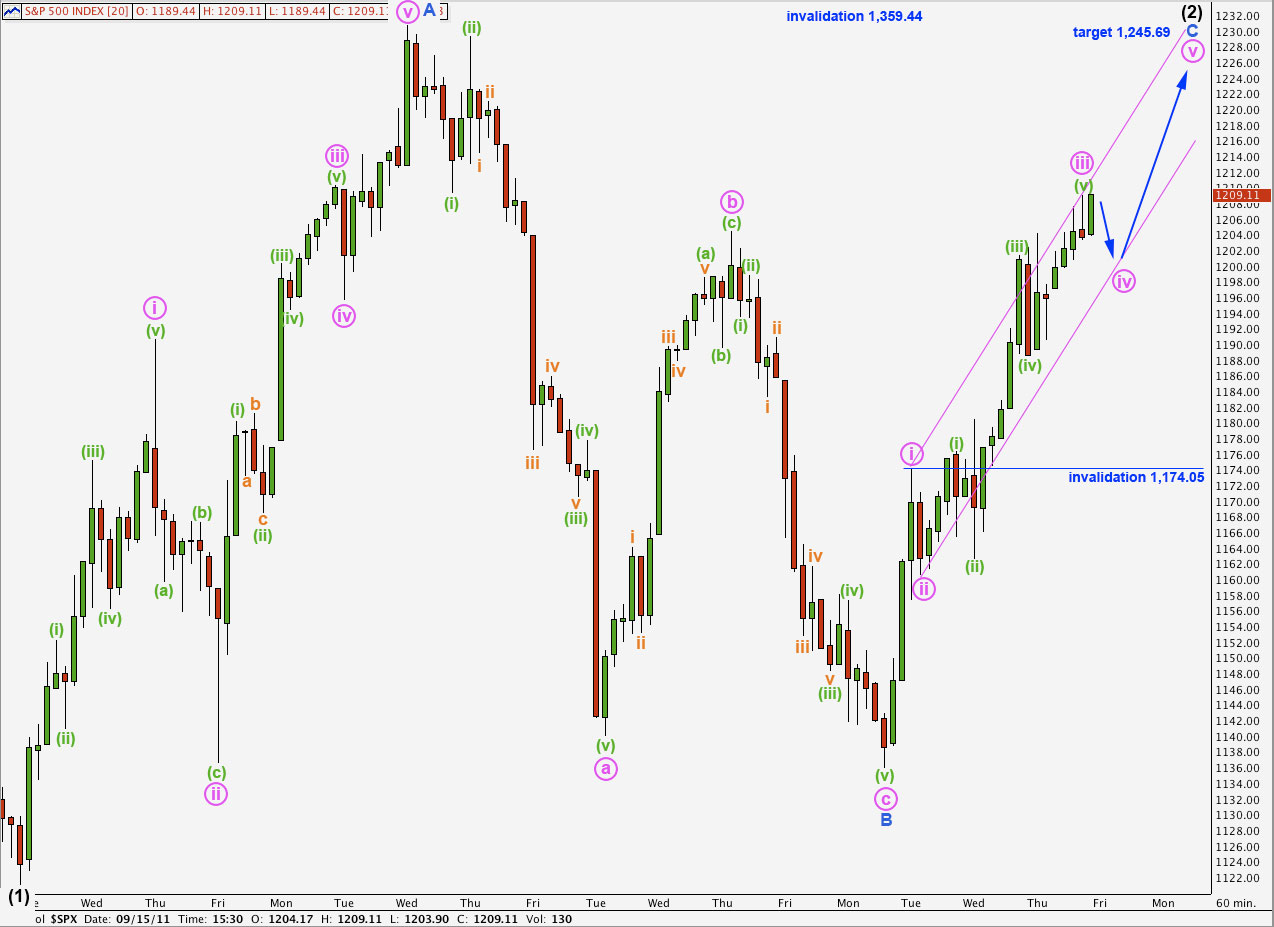
Alternately, if wave (2) black is a single zigzag structure, then wave C blue is incomplete and also requires further upwards movement.
We may use Elliot’s channeling technique about this impulse for wave C blue. Wave iv pink may end about the lower edge of this channel, and wave v pink to complete wave C blue may end about the upper edge of the channel.
Wave iv pink may not move into wave i pink price territory. This wave count is invalidated in the short term with movement below 1,174.05.
When waves iv and v pink are complete then we must remove the lower invalidation point. At that stage we would expect strong downwards movement in a third wave.
Second Alternate Hourly Wave Count.
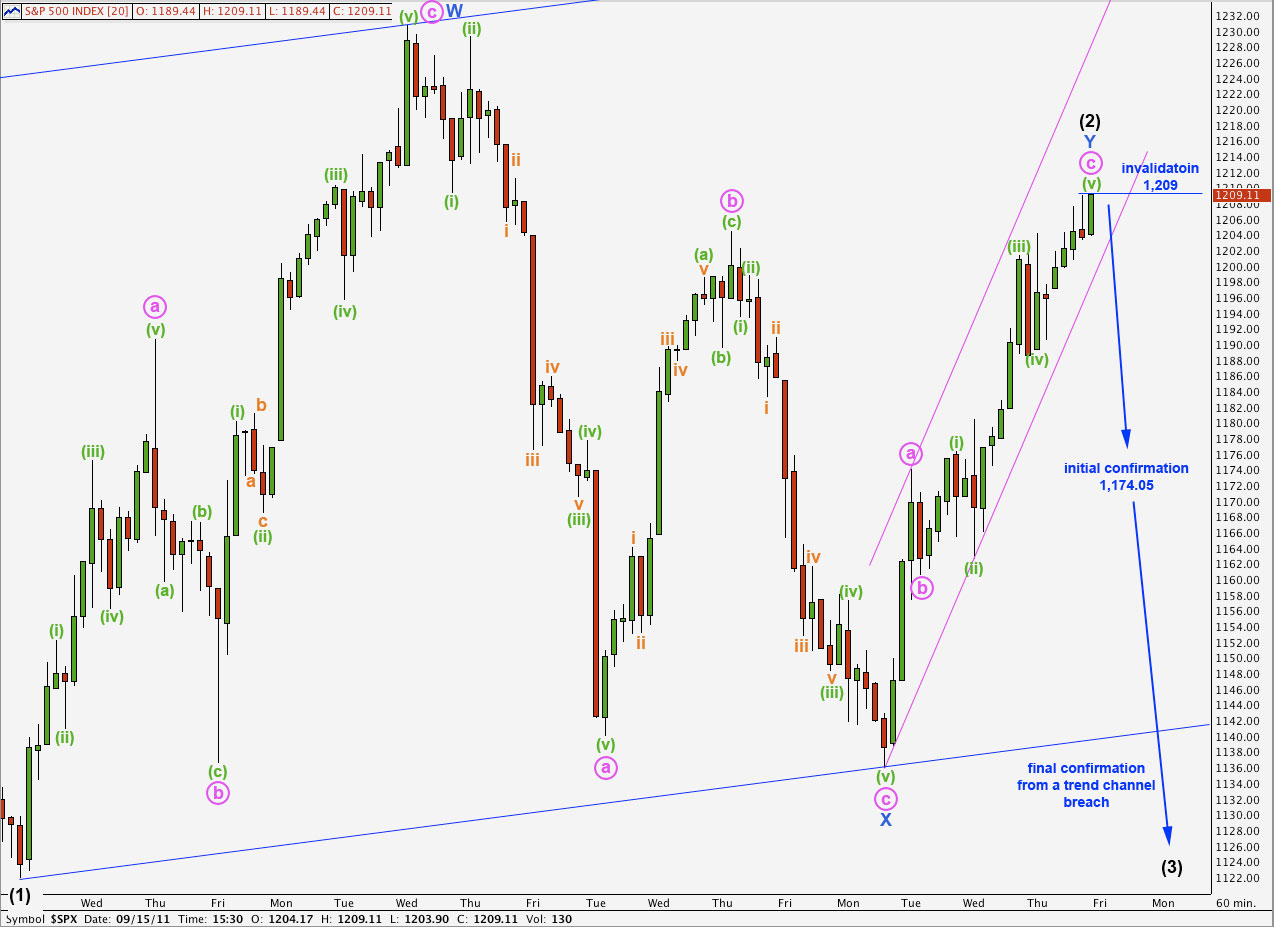
At this stage this wave count is the least likely of all three.
Upwards movement may be seen as a complete zigzag, and wave (2) black may be complete as a double zigzag structure.
The end of wave Y blue has not moved beyond the high of wave W blue; this is not correctly termed a truncation but this structure does not meet the function of a double zigzag which is to deepen the correction. This is why I consider this third wave count to have the lowest probability of all three today.
If our first two hourly wave counts are invalidated with movement below 1,174.05 then this will be our only hourly wave count. Once all the impossible scenarios are eliminated then whatever is left, no matter how improbable, must be correct.
A trend change would be finally confirmed after the channel drawn here and on the daily chart is breached by downwards movement.
The next movement for the S&P 500 according to this wave count would be violent strong downwards movement. Wave behaviour is important. If the next movement is downwards but does not exhibit third wave behaviour, that is if momentum is not strong, then we must consider other alternate scenarios.
I am aware that there is another alternate possibility which sees this upwards correction as wave 4 blue within wave (1) black, and so the next move down would be a fifth wave at blue (minor) degree to end wave (1) black. I will only chart this if it shows itself to be true. At this stage I do not want to chart it because I don’t think the subdivisions fit, particularly, the downwards movement from 1,208.47 on 17th August to 1,121.09 on 22nd August labeled 5 blue of (1) black on our daily chart. For this alternate scenario to work that wave must be seen as a three, and on the hourly chart it looks very strongly as a five.
I second William. I love the detailed analysis. The rest is up to us move through this crazy market
Thank you very much Alex
Can only say it is such a huge relief to have backup as detailed and thorough as this on a daily basis.
Well done again!
That’s great William! I’m really pleased you appreciate the work. My theory is if I complete this analysis as thoroughly as possible and follow all EW rules and as many guidelines as possible, then I should be right more often than wrong in the direction expected.
It’s really good reinforcement for me to hear you appreciate it. 🙂
I’m off to watch the All Blacks play Japan in the world cup now! Yay!