
Elliott Wave chart analysis for the S&P 500 for 9th September, 2011. Please click on the charts below to enlarge.
Analysis after Thursday’s session expected further upwards movement from the S&P 500 on Friday, but this is not what happened. Price moved significantly lower and the wave count remains valid.
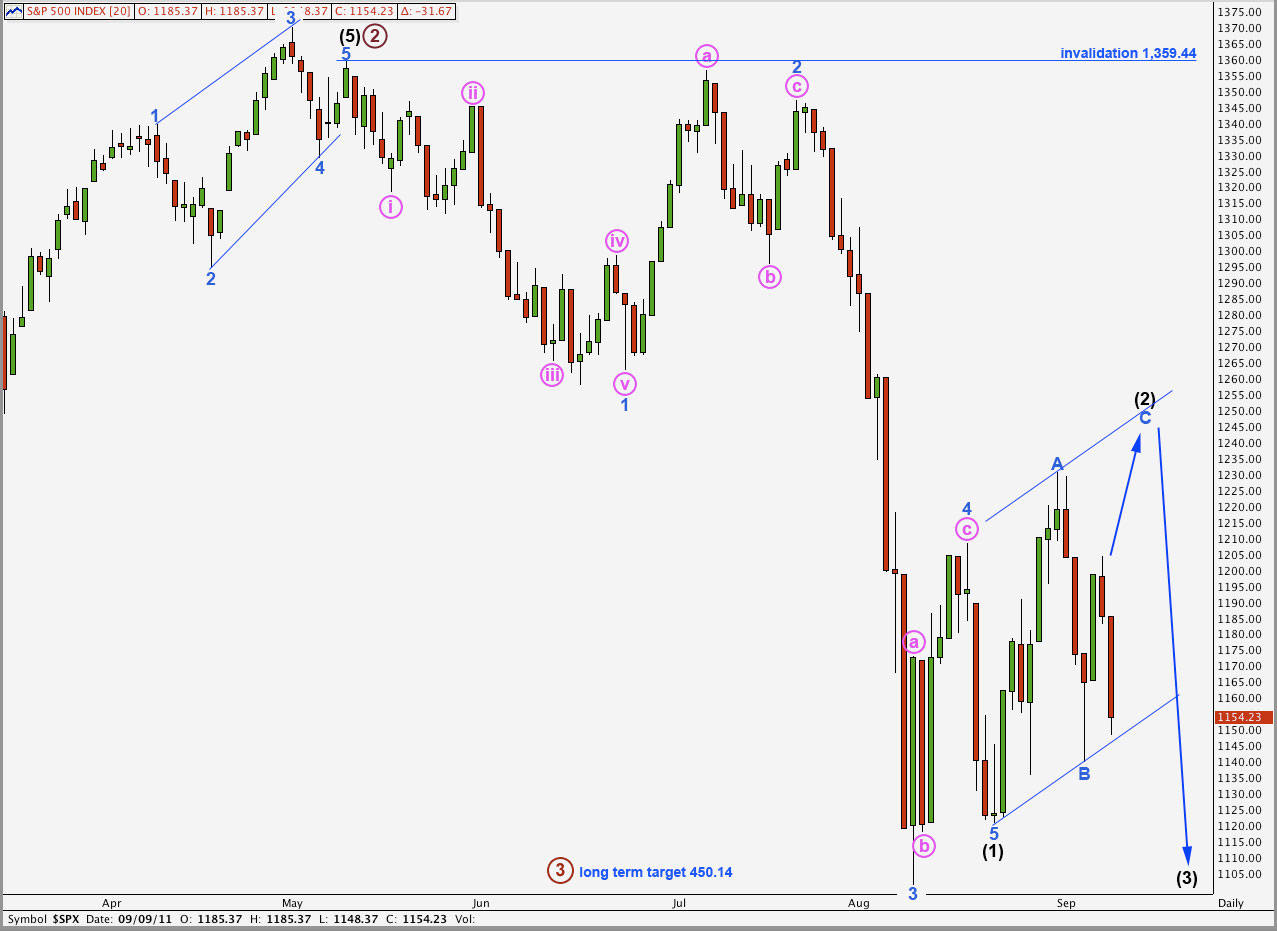
While price remains within the parallel channel containing this zigzag for wave (2) black the main hourly wave count below will have a higher probability. It is most likely that wave C blue will continue to take price higher, maybe ending Thursday the 15th of September this coming week.
If price breaks through the lower edge of the parallel channel the probability that wave (3) black has begun already will increase and we should use the alternate hourly wave count below.
Primary wave 3 would reach equality with primary wave 1 at 450.14. This long term target is months away at this stage.
Wave (2) black may not move beyond the start of wave (1) black. This wave count is invalidated with movement above 1,359.44.
Main Hourly Wave Count.
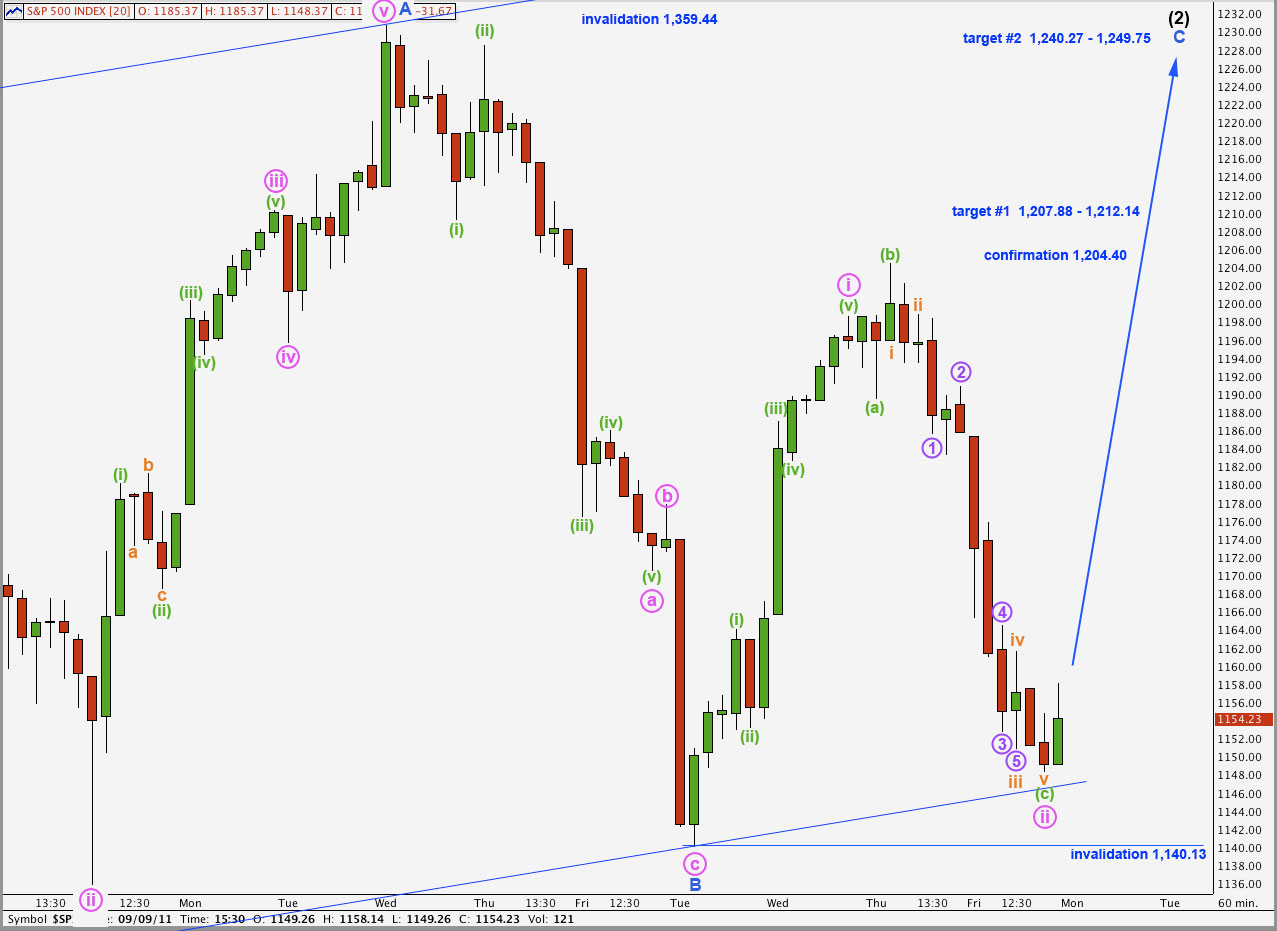
This wave count still has a higher probability than the alternate below, despite the strong downwards movement during Friday’s session. The subdivisions have a better fit.
Wave (c) green of the expanded flat for wave ii pink now has an extended third wave within it. Wave ii pink is a deep correction, as second waves can be, and this fits with the continuing evidence of very strong downwards pressure on the S&P 500.
There is no Fibonacci ratio between waves (a) and (c) green within wave ii pink.
Within wave (c) green I have determined the length of waves at orange and purple degree from a 5 minute chart. I have placed them as accurately as they can be placed on the hourly chart, but these ends do not directly correlate with their actual ends as seen on the 5 minute chart. Fibonacci ratios are calculated on the correct wave lengths.
Ratios within wave (c) green are: wave iii orange is 1.65 points longer than 4.236 the length of wave i orange, and there is no Fibonacci ratio between wave v orange and either of i or iii orange.
Ratios within wave iii orange of wave (c) green are: wave 3 purple has no Fibonacci ratio to wave 1 purple, and wave 5 purple is 0.29 points longer than 0.146 the length of wave 3 purple.
If wave ii pink is over and wave iii pink begins here it would reach 1.618 the length of wave i pink at 1,242.88. This may fit well with the second higher target and bring price to the upper edge of the parallel channel, giving wave (2) black a very typical look overall.
The first target zone for wave C blue to complete wave (2) black is between 1,207.88, where wave C blue would reach 0.618 the length of wave A blue, and 1,212.14 which is the 0.382 Fibonacci ratio of wave (1) black.
The second target zone for wave C blue to complete wave (2) black is at 1,249.75 where wave C blue would reach equality with wave A blue, which is close to the 0.5 ratio of wave (1) black at 1,240.27.
Any further downwards movement, any further extension of wave ii pink, may not move beyond the start of wave i pink below 1,140.13. This wave count is invalidated with movement below 1,140.13. At that stage we should use the alternate below.
Alternate Hourly Wave Count.
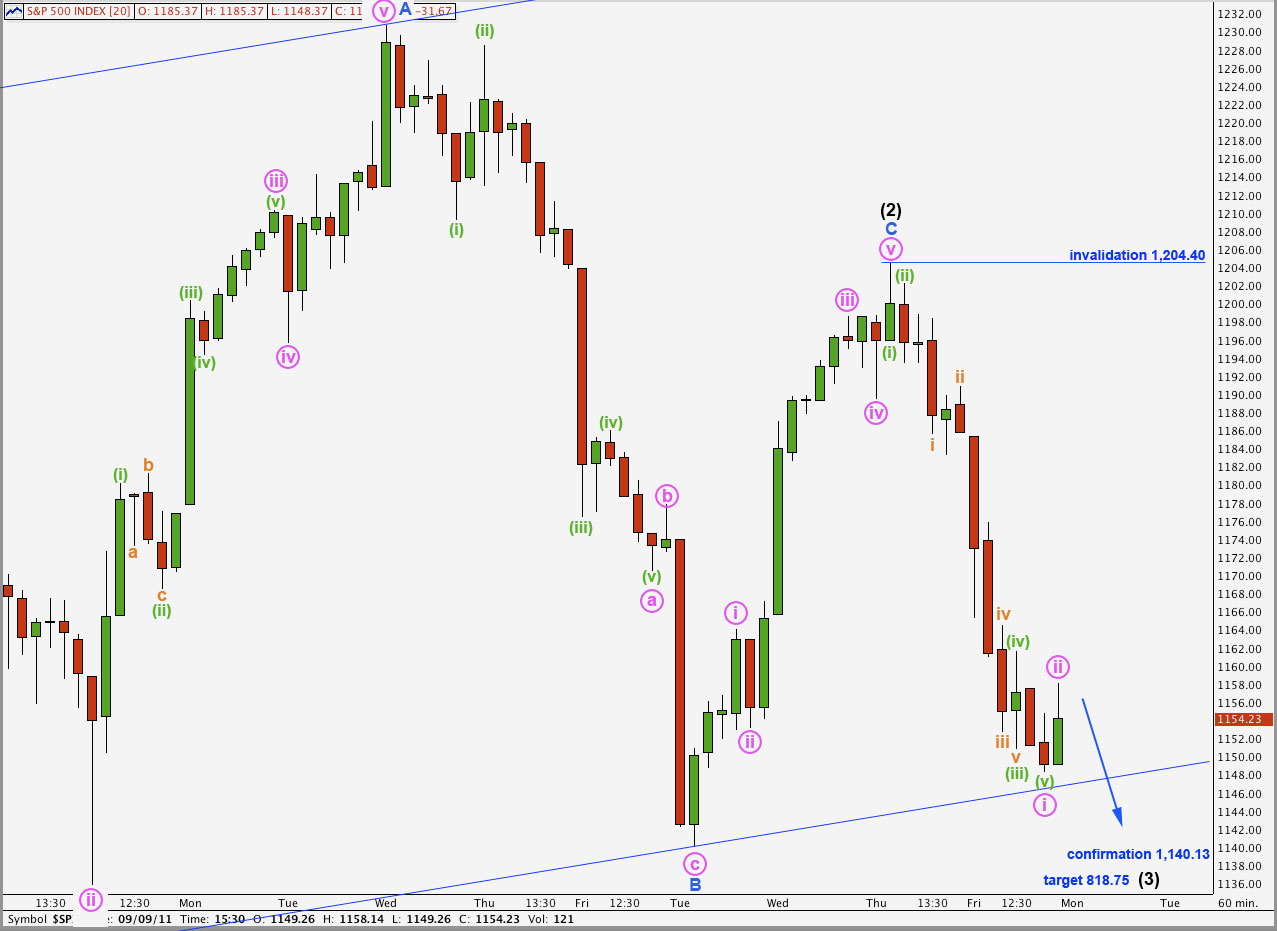
If price moves below 1,140.13 this wave count will be strongly confirmed. At that stage the probability that the S&P 500 has begun a third wave within a third wave will be extremely high.
If this wave count is correct we would not expect wave ii pink to extend much higher, if at all. It should be brief and shallow.
However, only movement above 1,204.40 would properly invalidate this wave count.
It is possible that wave (2) black is over, and this wave count relies upon seeing the end of wave v pink within wave C blue differently from the main hourly wave count. Wave C blue would be severely truncated, and although we may see a truncation as fairly likely this one is very large, which reduces the probability that it is correct.
If this wave count is confirmed then we should expect a continuation of downwards movement, with increasingly strong momentum, for at least a few more days. This downwards movement may be violent.
At 818.75 wave (3) black would reach 1.618 the length of wave (1) black.
I offer this wave count to end the week only as an outlying alternate, to be used if it is confirmed.
Lara,
It appears that your main wave count has been invalidated, but price action does not feel like an intermediate wave at 3rd degree. Are there any counts that you can see where the market might still be working toward the end of intermediate wave 1? Thanks.
Peter
lara daneric is running with a count that suggests we have completed w4 on the the first big wave down within 3..and are thus are now about in the third subwave down of the final wave to complete one down. what do you see in his interpretation that you disagree with in favoring your count? tks
I’ve taken a look at his count. His (b) pink down must be seen as a three, I’m pretty sure that’s a five and so I don’t want to see it as a (b) wave. That is the wave I have as the truncated fifth.
However, with price invalidating the main hourly wave count but not looking like a third of a third wave, I’m going to have to consider all possibilities and look for as many alternates as I can see. My initial thought is wave (2) black is a double combination and this is the second structure within that, and probably a flat.
Looks like we shall have alternate wave counts to work with after this session is closed.