
Elliott Wave chart analysis for the S&P 500 for 7th September, 2011. Please click on the charts below to enlarge.
As expected from our main count yesterday the S&P 500 moved higher. It has not yet reached our first target and it is very likely this structure requires further upwards movement to complete.
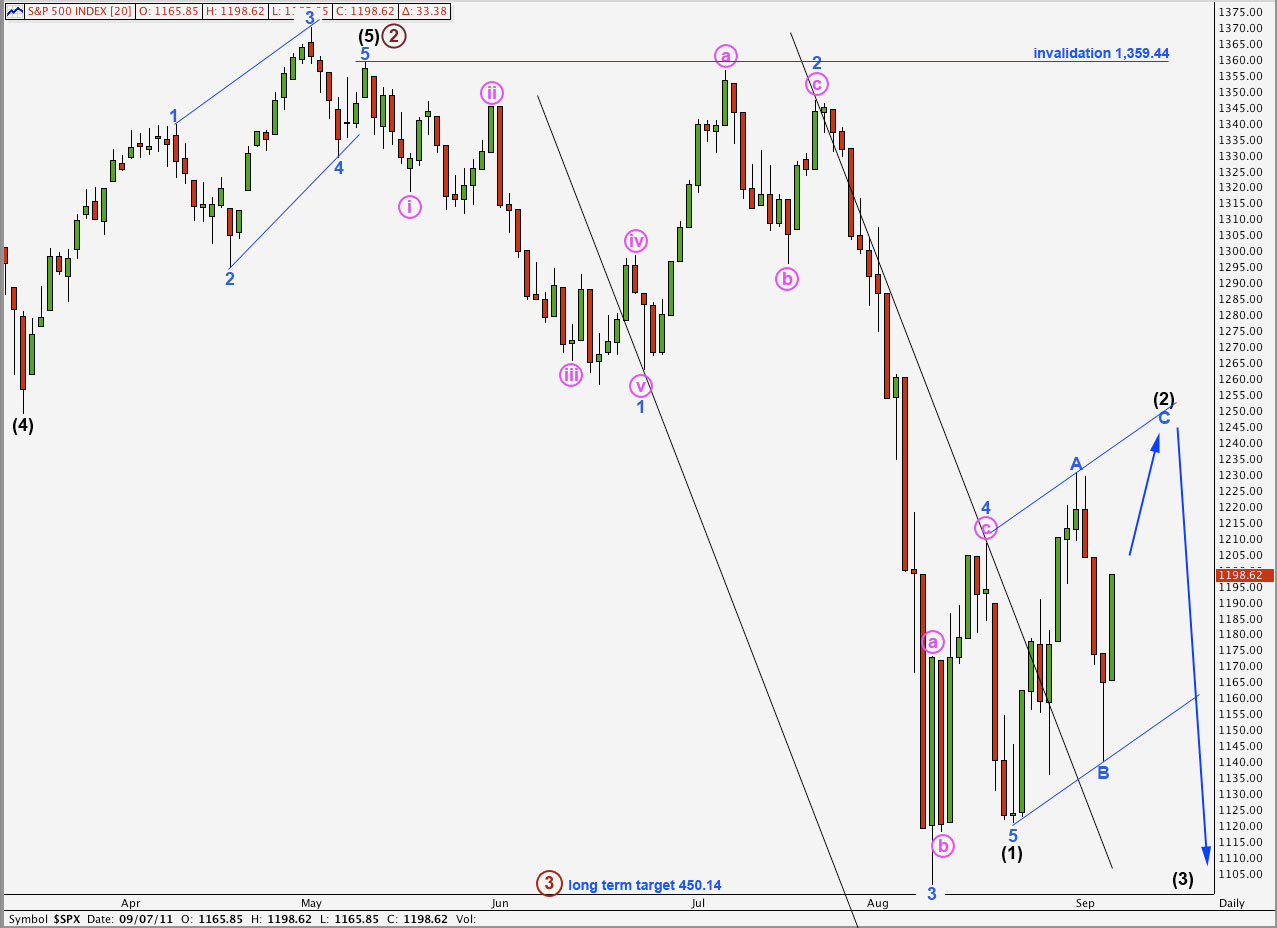
Wave (2) black is unfolding as a zigzag, or a double zigzag, or a double combination in which the first structure is a zigzag. It is most likely that wave (2) black will be a single zigzag and it may be over about the end of this week, or possibly early next week.
When wave (2) black is complete the next movement for the S&P 500 should be downwards, with increasing momentum. This third wave within a third wave may be explosive and violent.
Wave (2) black may not move beyond the start of wave (1) black. This wave count is invalidated with movement above 1,359.44.
We may now use Elliott’s technique to draw a parallel channel about the correction for wave (2) black. Wave C blue may end about the upper edge of this parallel channel for this zigzag to have a typical look.
I have only one hourly wave count for us today.
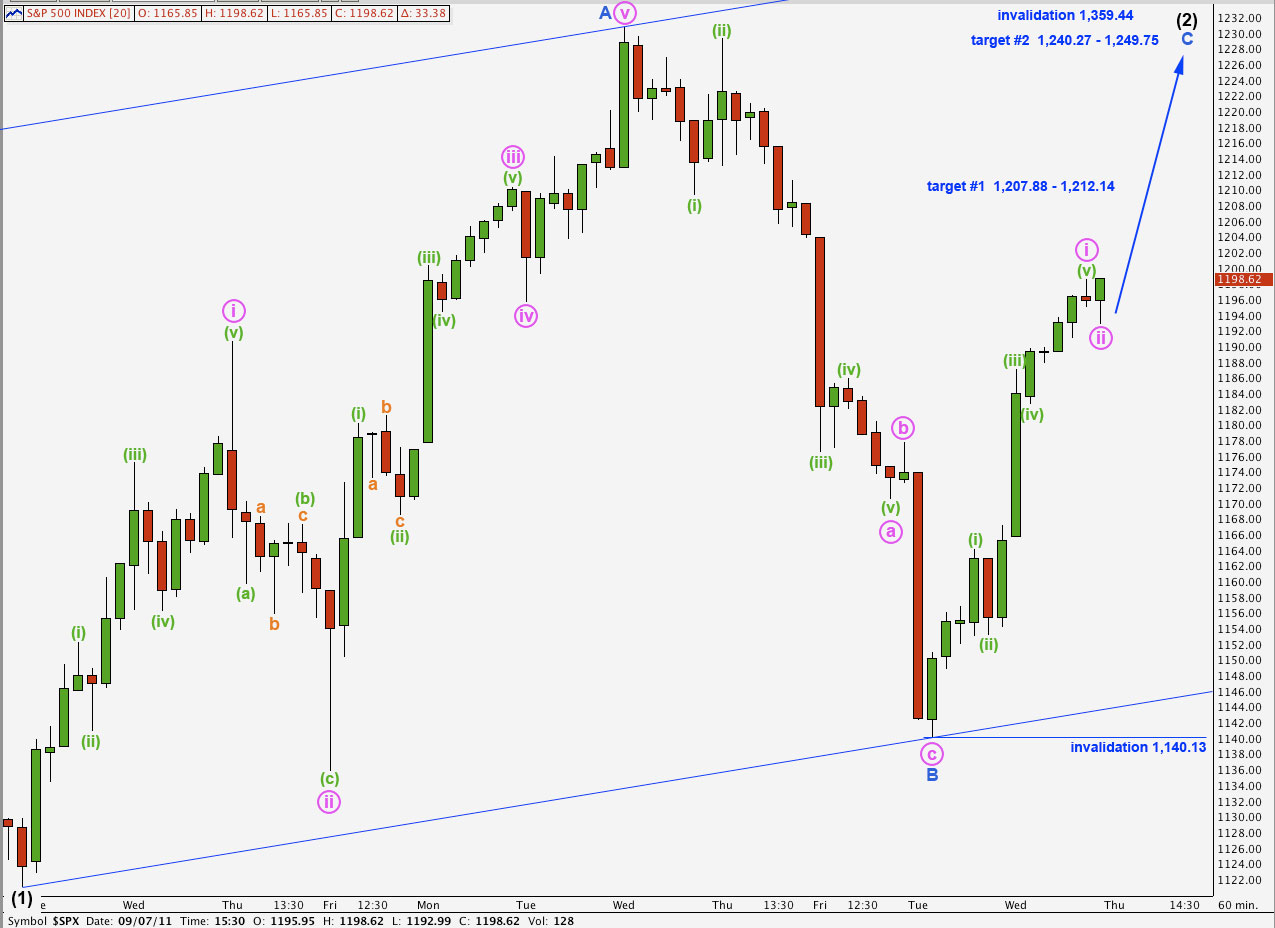
This hourly chart shows all of wave (2) black so far. Because wave A blue subdivided into a five wave (2) black (or at least the first structure within it) is a zigzag.
Wave C blue must also subdivide into a five wave structure. There are two options for a C wave, either an impulse or an ending diagonal. Because an ending diagonal requires all subwaves to be zigzags we may eliminate this option for wave C blue as wave i pink is clearly an impulse.
Ratios within wave i pink of wave C blue are: wave (iii) green has no Fibonacci ratio to wave (i) green, and wave (v) green is 1.09 points longer than 0.618 the length of wave (i) green.
Wave ii pink may not move beyond the start of wave i pink. The lower invalidation point today must be at 1,140.13. However, the structure of wave ii pink on the 5 minute chart is complete, and it is likely that it is over already.
Our targets remain the same as yesterday.
At 1,207.88 wave C blue would reach 0.618 the length of wave A blue, and would be truncated. This is fairly close to the 0.382 Fibonacci ratio of wave (1) black at 1,212.14. Our first target zone is 1,207.88 to 1,212.14. Although this would see wave C blue truncated it still has a reasonable probability. Strong downwards pressure may cause a truncation.
At 1,249.75 wave C blue would reach equality in length with wave A blue. This is somewhat close to the 0.5 ratio of wave (1) black at 1,240.27. Our second target zone is 1,240.27 to 1,249.75. This second target zone may be more likely than the first.
We should continue to draw the wide parallel channel here on hourly and daily charts. The upper trend line may indicate where and when wave C blue may end.
Lara–
One count. I like it!
If this zigzag were considered a “Bear Flag” and the breakout comes at around 1160, the downside target would be about 910-920. (length of flog pole minus breakout)
Is that a reasonable short term Elliott Wave target as well?
I hope everything is going great for you.
Hi John,
If C completes this zigzag around about the second higher target I have then (3) down to follow it may end around about 864. So I would most likely get a target just below yours of 920 – 910. However, we cannot really calculate a target with any reasonable accuracy until we know where (2) ends and (3) begins.
I’m not familiar with a “bear flag” although I think I get the idea. I’ve never heard of a “flog pole” before though, and I’m not sure I want to guess what that’s all about 🙂
Everything is going great down here in Kiwiland. I’m SO excited about the world cup! It starts tomorrow.
Flag Pole!!! OOPS!! Haha!
http://chart-patterns.netfirms.com/bearflag.htm
Ha ha! Yeah, I thought about just how far I could take that one and decided it may be best avoided, to keep it clean 🙂
Thanks for the laugh John!