
Elliott Wave chart analysis for the S&P 500 for 6th September, 2011. Please click on the charts below to enlarge.
We had expected the new trading week to start with a little upwards movement for a small B wave and this did not happen. Thereafter, we expected further downwards movement to complete a zigzag for wave B blue and this may now be over.
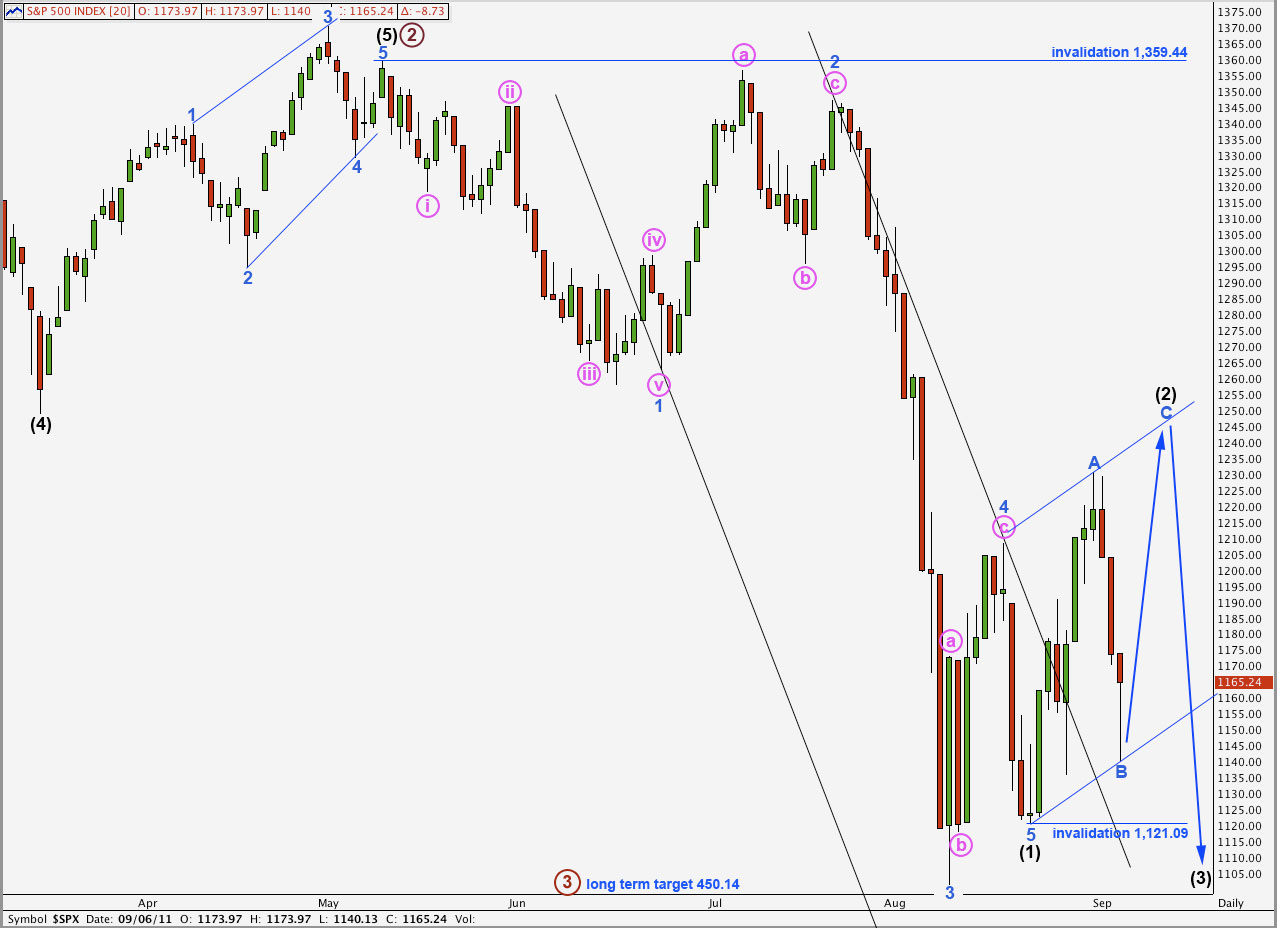
Wave (2) black is unfolding as a zigzag, or a double zigzag, or a double combination in which the first structure is a zigzag. It is most likely that wave (2) black will be a single zigzag and it may be over about the end of this week.
When wave (2) black is complete the next movement for the S&P 500 should be downwards, with increasing momentum. This third wave within a third wave may be explosive and violent.
Wave (2) black may not move beyond the start of wave (1) black. This wave count is invalidated with movement above 1,359.44.
We may now use Elliott’s technique to draw a parallel channel about the correction for wave (2) black. Wave C blue may end about the upper edge of this parallel channel for this zigzag to have a typical look.
In trying to consider all possibilities at this crucial juncture I have two hourly wave counts for us to consider today. I favour the main hourly wave count significantly as I consider the subdivisions to have a much better fit.
We may use confirmation and invalidation points to differentiate between the two wave counts in the next day or two.
Main Hourly Wave Count.
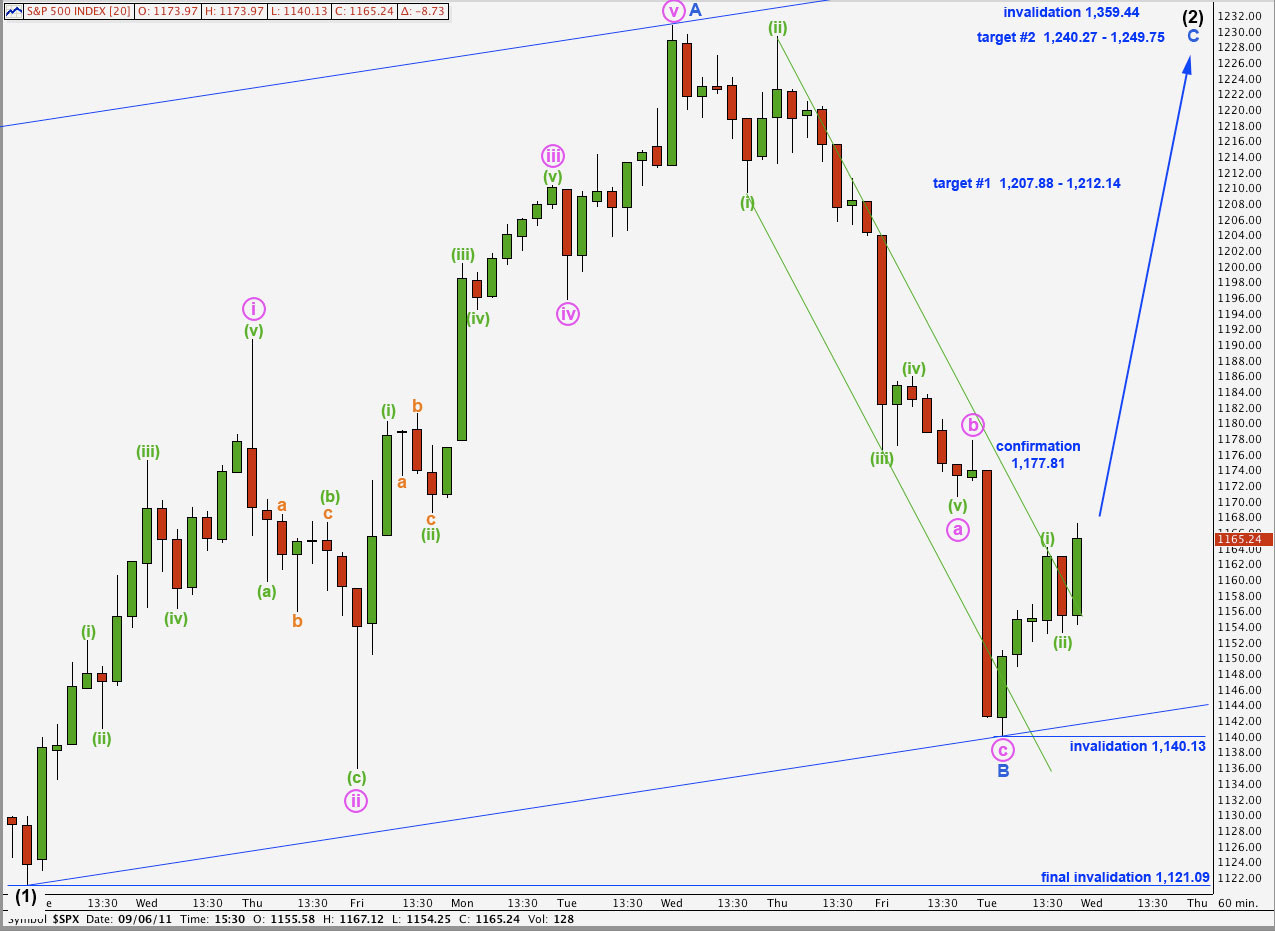
Last analysis hourly wave count expected the new week to begin with at least a little upwards movement and this did not happen. Wave b pink may have been brief and shallow, ending on Friday.
Wave c pink is just 0.51 points longer than 0.618 the length of wave a pink. Despite the brevity of wave b pink it is very likely that the zigzag for wave B blue is complete as the wave structure is complete and there is a very close Fibonacci ratio between waves a and c.
Movement above 1,177.81 would confirm wave (2) black as incomplete. At that stage we may have further confidence in this wave count.
At 1,207.88 wave C blue would reach 0.618 the length of wave A blue, and would be truncated. This is fairly close to the 0.382 Fibonacci ratio of wave (1) black at 1,212.14. Our first target zone is 1,207.88 to 1,212.14. Although this would see wave C blue truncated it still has a reasonable probability. There is some continuing evidence of strong downwards pressure in yesterday’s strong momentum, along with the running flat within wave ii pink of wave A blue upwards. This downwards pressure may cause a truncation.
At 1,249.75 wave C blue would reach equality in length with wave A blue. This is somewhat close to the 0.5 ratio of wave (1) black at 1,240.27. Our second target zone is 1,240.27 to 1,249.75. This second target zone may be only slightly more likely than the first.
Wave C blue must subdivide into a five wave structure at pink degree.
If we see any further downwards movement at this stage wave B blue may not extend lower beyond the start of wave A blue. This wave count is invalidated with movement below 1,121.09.
If labeling of recent movement is correct we should not see movement below the start of wave (i) green within wave C blue below 1,140.13.
If price moves below 1,121.09 we should use the alternate hourly wave count below.
Alternate Hourly Wave Count.
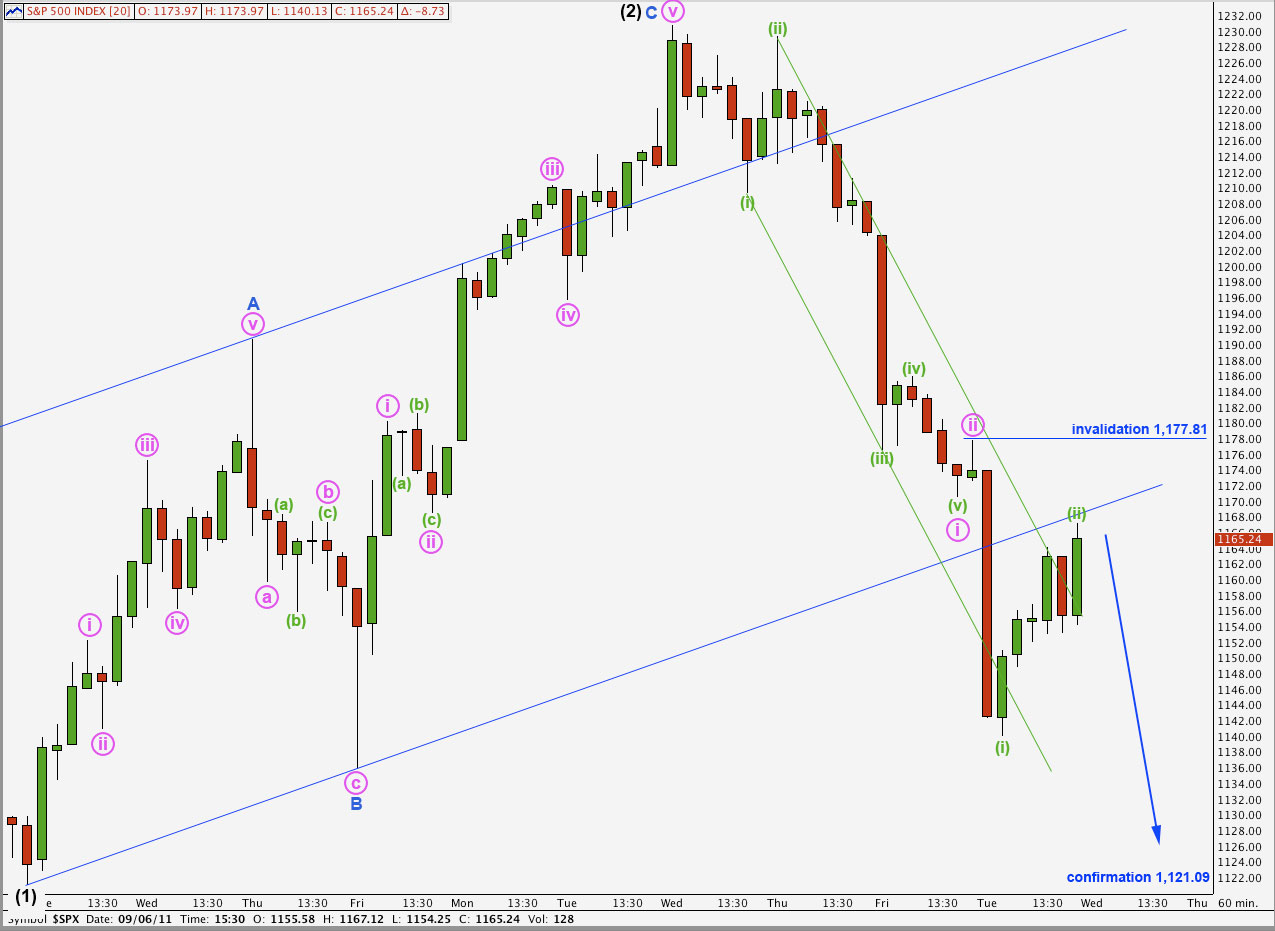
I wanted to see how a wave count with wave (2) black complete would look. The subdivisions within wave C blue of wave (2) black are here unsatisfactory. Wave iii pink within wave C blue does not have a very good fit on the 5 minute chart.
We should only use this wave count if it is proved to be correct with movement below 1,121.09.
If this wave count were correct it would be a little odd to see wave (ii) green within wave iii pink of wave 3 blue of wave (3) black being a deep and time consuming correction. At that stage of the third wave the drop downwards should be sheer.
Wave (ii) green may not move beyond the start of wave (i) green. This wave count would be invalidated with movement above 1,177.81.
Lara, I think you have mislabelled your confirmation-invalidation points on your hourly counts at 1230.71?
You are right Alex, thank you for pointing that out. I’ll fix now.