
Elliott Wave chart analysis for Gold for 4th September, 2011. Please click on the charts below to enlarge.
There are some remarkably good fibonacci relationships in this analysis.
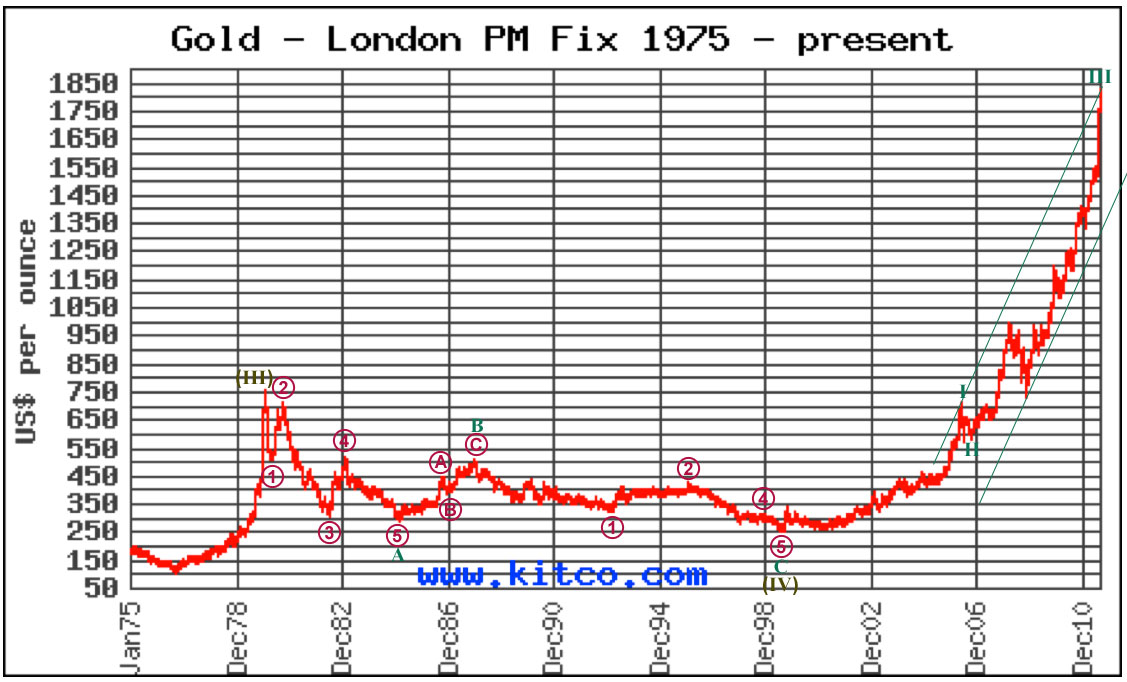
Within super cycle wave IV, cycle wave A ending Feb 1985 lasted a fibonacci 54 months. Cycle wave B ending Dec 1987 was a 50% correction of wave A and lasted a fibonacci 34 months. Cycle wave C is 234.61 in length and is just 3.16 longer than 0.618 the length of cycle A, and lasted 141 months, just 3 short of a fibonacci 144.
Cycle wave III within super cycle wave V may have recently ended.
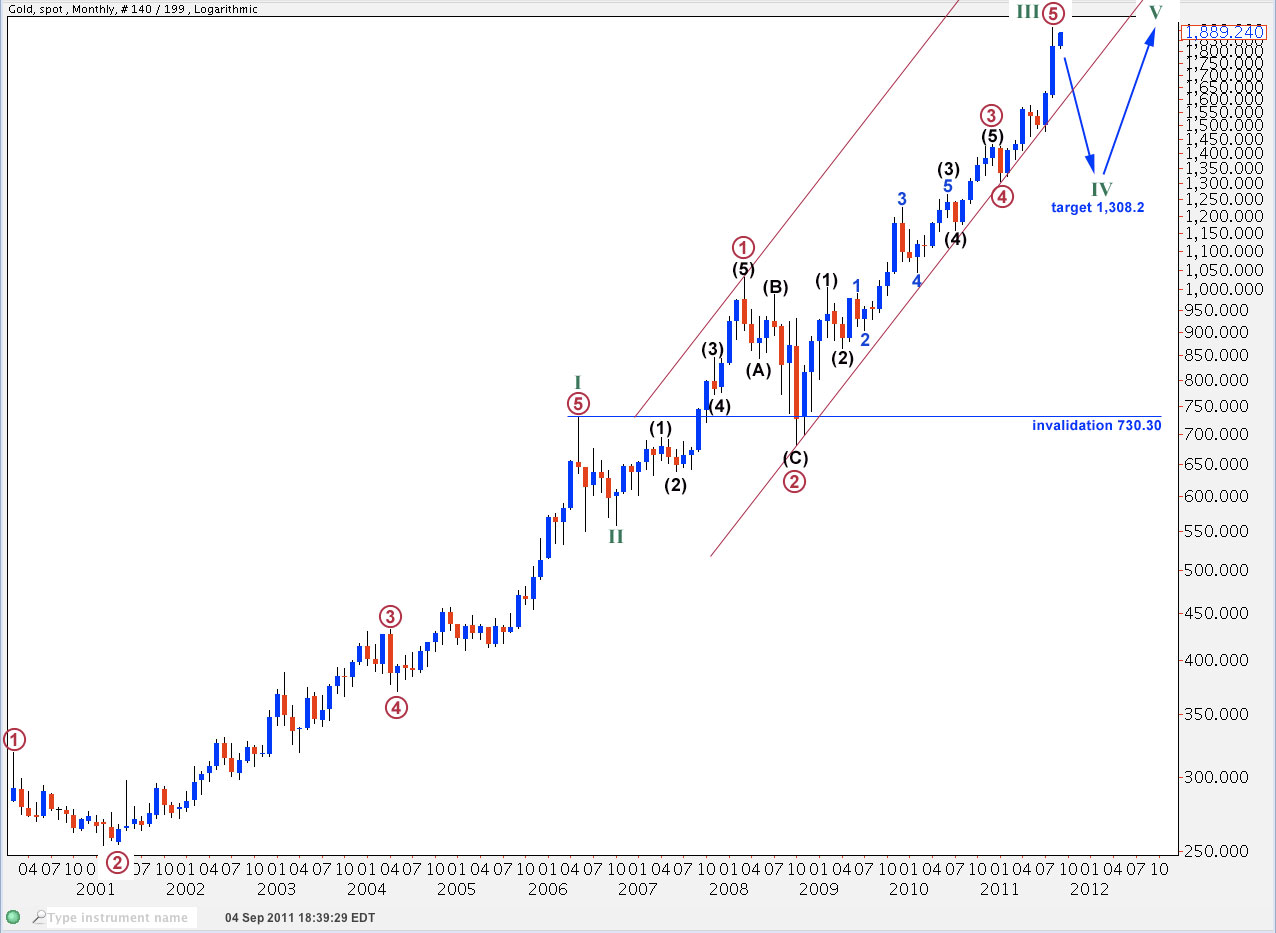
After last analysis gold did not move higher, and I expect that cycle wave III is probably over.
The correction that gold is most likely currently in may last about a year or so.
Cycle wave IV may not move into cycle wave I price territory. This wave count is invalidated with movement below 730.30.
Cycle wave III at 1,352.82 in length is 100.11 longer than 2.618 the length of cycle wave I. This variation is less than 10% the length of cycle wave III and may be considered an acceptable Fibonaaci ratio.
Ratios within cycle wave III are: primary (maroon) wave 3 is 15.47 short of 1.618 the length of primary wave 1, and primary wave 5 has no Fibonacci ratio to either of primary waves 3 or 1.
Ratios within primary wave 3 are: black wave (3) has no Fibonacci ratio to black wave (1), and black wave (5) is 2504 longer than equality with black wave (3).
Ratios within primary wave 1 are: black wave (3) has no Fibonacci ratio to black wave (1), and black wave (5) is just 5.27 longer than 1.618 the length of black wave (1).
At this early stage cycle wave IV looks most likely to be a flat correction. Wave B within it is very likely to make a new high. Thereafter, wave C downwards to end it may end about the fourth wave of once lesser degree. Primary wave 4 has its end at 1,308.2.
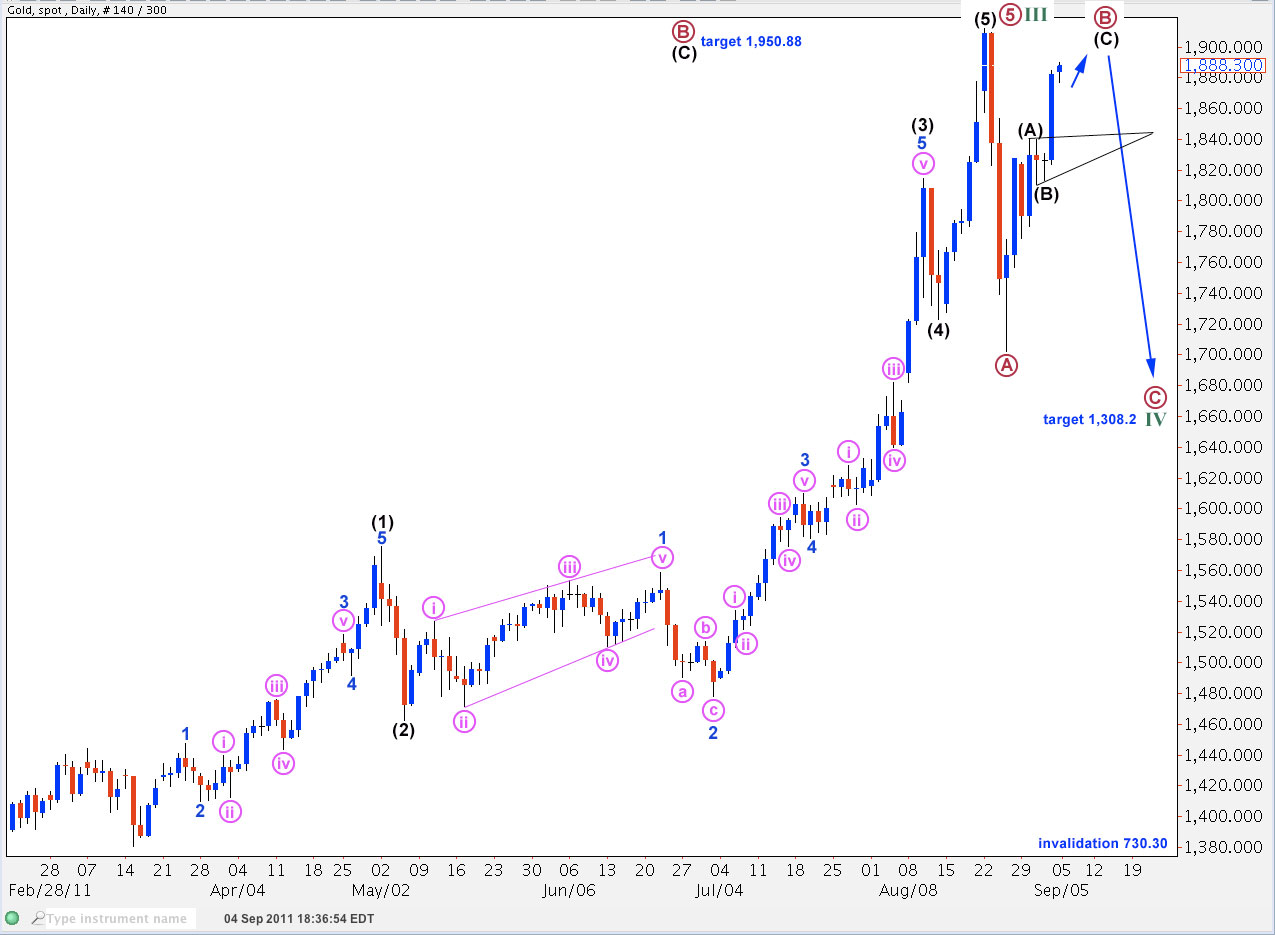
The daily chart shows all of primary wave 5 to end cycle wave III.
Within primary wave 5 there are no Fibonacci ratios between black waves (1), (3) and (5).
Ratios within black wave (1) of primary wave 5 are: wave 3 blue has no Fibonacci ratio to wave 1 blue, and wave 5 blue is just 2.65 points short of 0.618 the length of wave 1 blue.
Ratios within blue wave 3 of black wave (1) are: wave iii pink has no Fibonacci ratio to wave i pink, and wave v pink is just 2.88 points short of 2.618 the length of wave i pink.
Ratios within wave (3) black of primary wave 5 are: wave 3 blue has no Fibonacci ratio to wave 1 blue, and wave 5 blue is 18.24 points short of 2.618 the length of wave 1 blue.
Within blue wave 3 of black wave (3) there are no Fibonacci ratios between pink waves i, iii and v.
Ratios within blue wave 5 of black wave (3) are: wave iii pink is 1041 points short of 1.618 the length of pink wave i, and pink wave v has no Fibonacci ratio to either of pink waves iii or i.
Within cycle wave IV primary wave A subdivides into a three wave structure when viewed on the 8 hour chart. For this reason I expect cycle wave IV is most likely to unfold as a flat correction, although it may also be a triangle.
Primary wave B should reach at least to 1,891.07 because within a flat wave B must be at least 90% the length of wave A.
At 1,950.88 wave (C) black would reach equality with wave (A) black within primary wave B. This is the most likely target for the current upwards movement to end.
Wave (B) black may have been a barrier triangle. At the point in time in which the triangle trend lines cross we may see a trend change.
Thanks Lara. Your gold analysis collaborates well with some of the other analysis tools that I use. I think that most would agree that gold has been in a very powerful bubble. Like many bubbles, the bursting can be quick and violent.
Best of luck trading. Thanks again.
Tom from Florida