
Elliott Wave chart analysis for the S&P 500 for 26th August, 2011. Please click on the charts below to enlarge.
All three of Thursday’s hourly wave counts expected downwards movement from the S&P 500, and we did get some, followed by a deep retracement.
The structure of the last small downwards wave on the hourly chart is important and has changed our hourly wave counts.
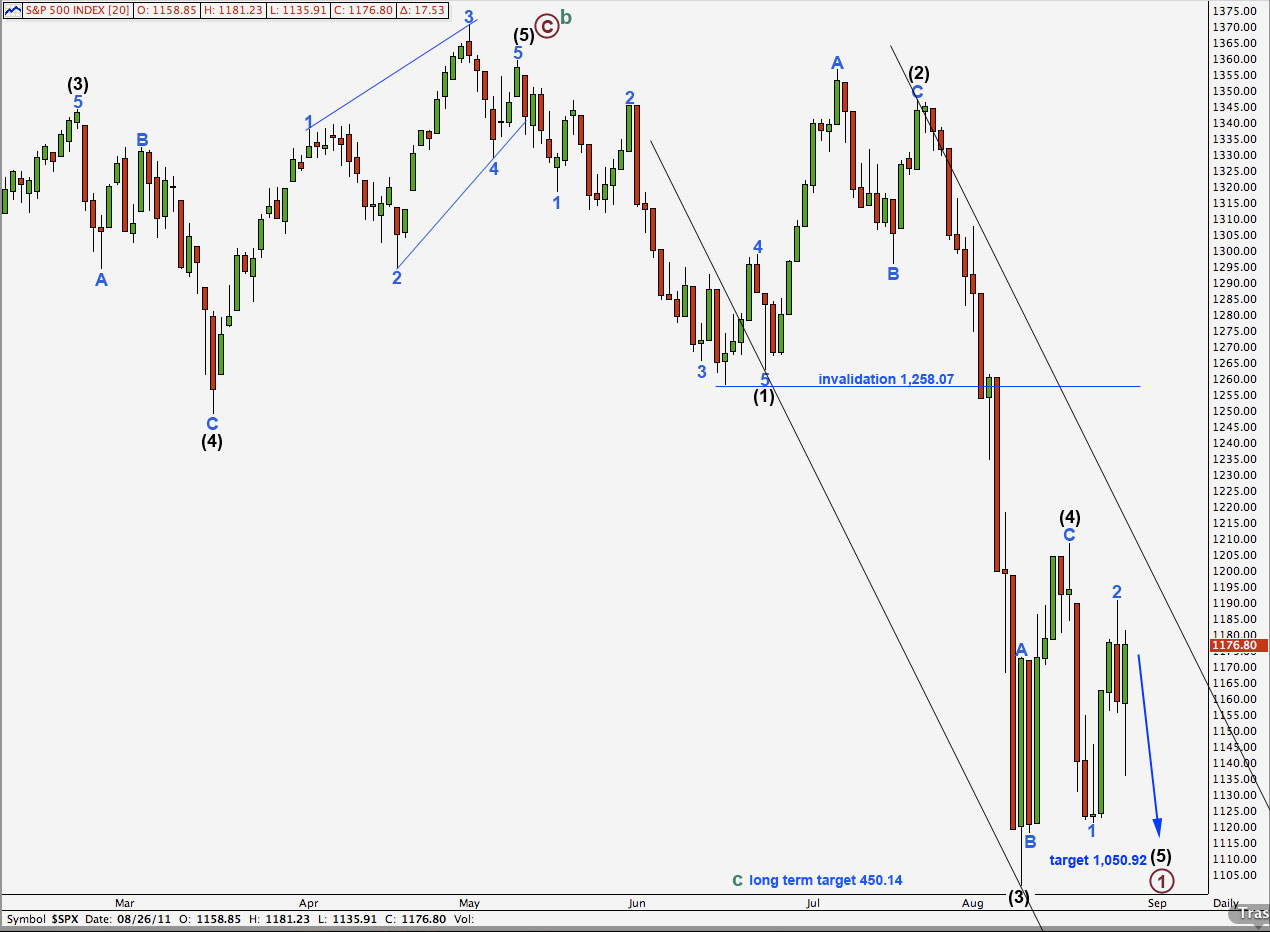
We have only two hourly wave counts for this end of week analysis. The first still expects that wave (4) black is over, and its duration would be about equal with equivalent corrections within cycle wave a.
I have looked again at the historic count. If we revert to the original historic count, which sees the S&P 500 as within cycle wave c down of a super cycle expanded flat with cycle wave c beginning at 1,576.09 and the current wave being primary wave 3 of cycle wave c beginning at the high labeled here cycle wave b, then the durations for the “credit crunch” and this current downwards wave would fit much better. If we would move recent downwards movement all down one degree of labeling this current correction would be blue (minor) degree, which should last about a week to a few weeks. I will chart this possibility and post it as an alternate within the historic analysis tomorrow.
The problem with that, and the reason why I changed the historic count in the first place, is that some of the indices made new all time highs recently. For those indices (such as the Russell 2000) that wave count does not fit because primary wave 2 may not move beyond the start of primary wave 1. It seems odd that the Russell 2000 should have a wave count which expects five down while the S&P 500 and DJIA expect only another three down. However, they are separate markets and each has its own wave count. The wave structure on the monthly charts certainly does have a very different look for each.
First Hourly Wave Count.
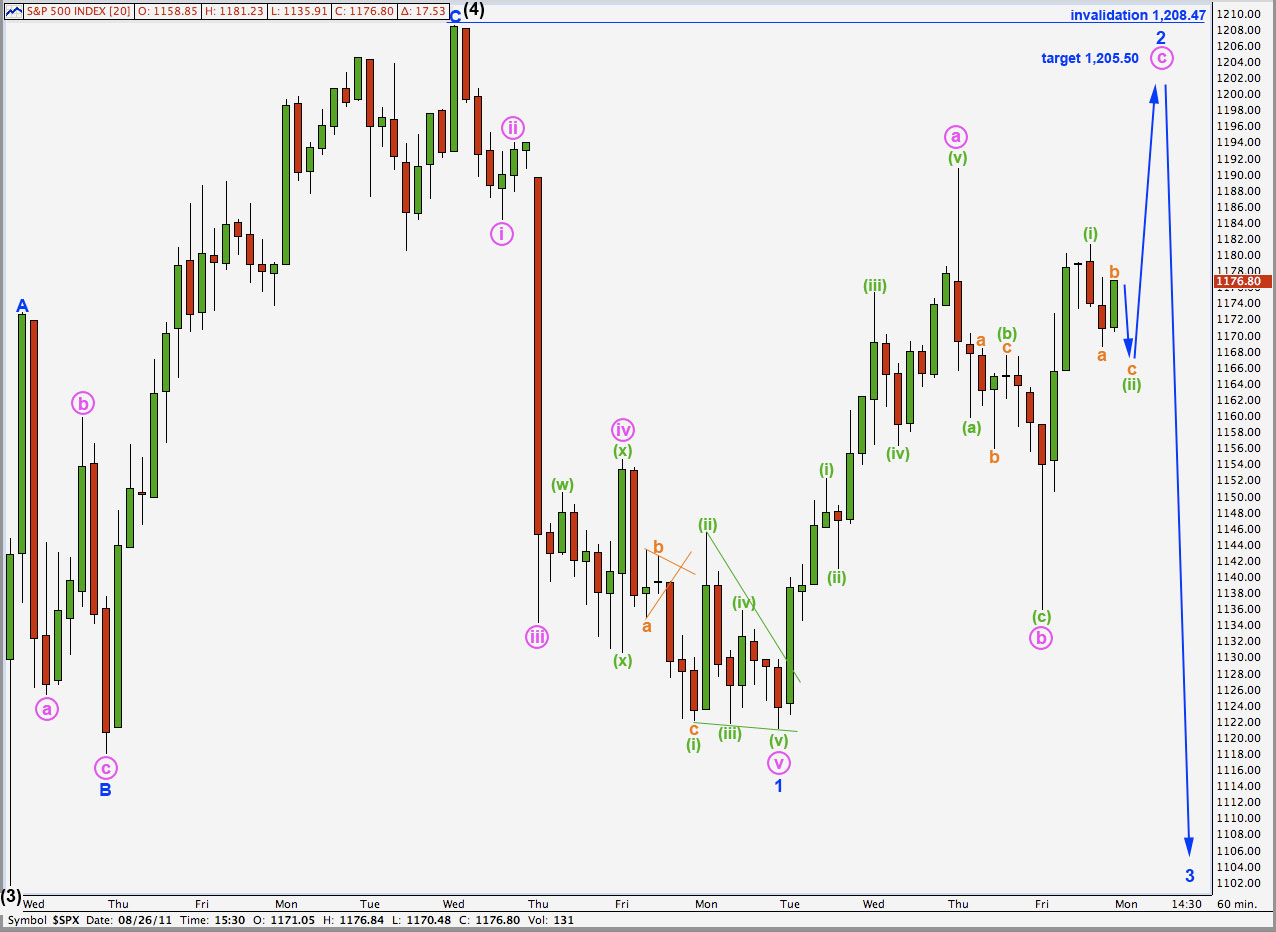
Again, this first hourly wave count expects that wave (4) black is complete.
The downwards movement we saw on Friday was followed by a deep upwards wave. With this upwards wave taking price above the prior low, labeled (a) green within b pink, this upwards movement may not be a fourth wave of a new impulse downwards. The downwards wave labeled b pink is now clearly over as a three wave structure. This has changed the wave count on the hourly chart.
Wave 2 blue is incomplete and the three down would have been wave b pink within it.
Wave a pink upwards must here be seen as a five wave structure rather than the double zigzag I had it labeled as for last analysis. I have checked this on a 5 minute chart and it does also fit.
Within wave a pink ratios are: wave (iii) green is just 3.2 points longer than equality with wave (i) green and wave (v) green is just 0.1 points longer than equality with wave (iii) green.
Within wave b pink wave (c) green is just 0.62 points longer than equality with wave (a) green.
Because wave c pink is most likely to end beyond the end of wave a pink to avoid a truncation, it is unlikely that it is over at 1,181.23. This is probably only wave (i) green of wave c pink.
At 1,205.50 wave c pink would reach equality with wave a pink. Wave 2 blue may end as a very deep correction about here.
Wave 2 may not move beyond the start of wave 1. This wave count is invalidated with movement above 1,208.47.
Second Hourly Wave Count.
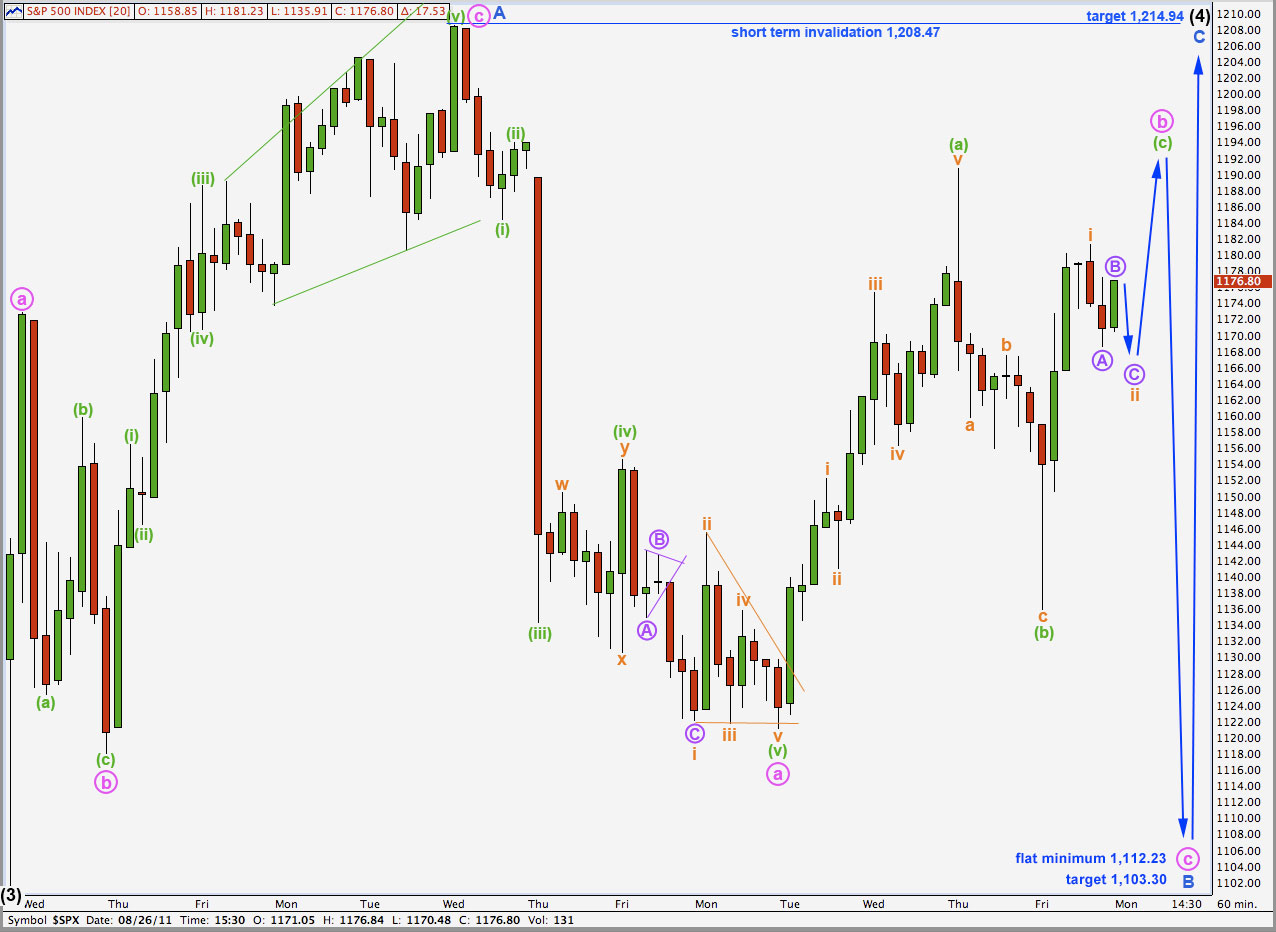
This wave count covers two possible structures for wave (4) black, if it is not yet over.
Wave (4) black may be continuing as either a flat or a triangle.
Wave b pink may not move beyond the start of wave a pink. This wave count is invalidated with movement above 1,208.47.
If wave B blue ends at 1,112.23 or below then wave (4) black may be continuing as a flat correction.
If wave B blue fails to reach 1,112.23 then wave (4) black would be a triangle.
Wave B blue may take price below the start of wave A blue at 1,101.54 if wave (4) black is an expanded flat or a running triangle. There is no downwards invalidation point.
Wave B blue is unfolding as a zigzag because wave a pink subdivided into a five wave impulse. Wave b of a zigzag may not move beyond the start of wave a. This wave count is invalidated in the short term with movement above 1,208.47.
The eventual target for wave (4) black to end remains about the fourth wave of one lesser degree, at 1,214.94 which is where wave 4 blue has its end.
If wave (4) black were not over and was continuing this could bring price to touch the upper edge of the parallel channel on the daily chart, giving this impulsive structure downwards an overall typical look.
Sorry, I mean Wave 1 Marroon….we are in Wave 2 Marroon
Yes I have, I think I mentioned it in the video today.
It certainly is possible, and we could see a truncation after that incredibly strong third wave “travelled too far too fast”.
If our hourly wave counts are invalidated by movement above 1,208.47 then this would be the only valid explanation that I could see. Perhaps because of that I should have charted it for us, because it would be entering a third wave up on Monday.
I chose to not chart and present it because of the truncation reducing the probability.
Looking again at our hourly charts I think I should chart this possibility properly and publish it for us.
I’ll do it tomorrow, before NY opens for Monday morning.
have you considered that Wave 1 blue had a truncated 5th and that this is Wave 2 Blue. It has been presented on a couple of other sites….