
Elliott Wave chart analysis for the S&P 500 for 26th August, 2011. Please click on the charts below to enlarge.
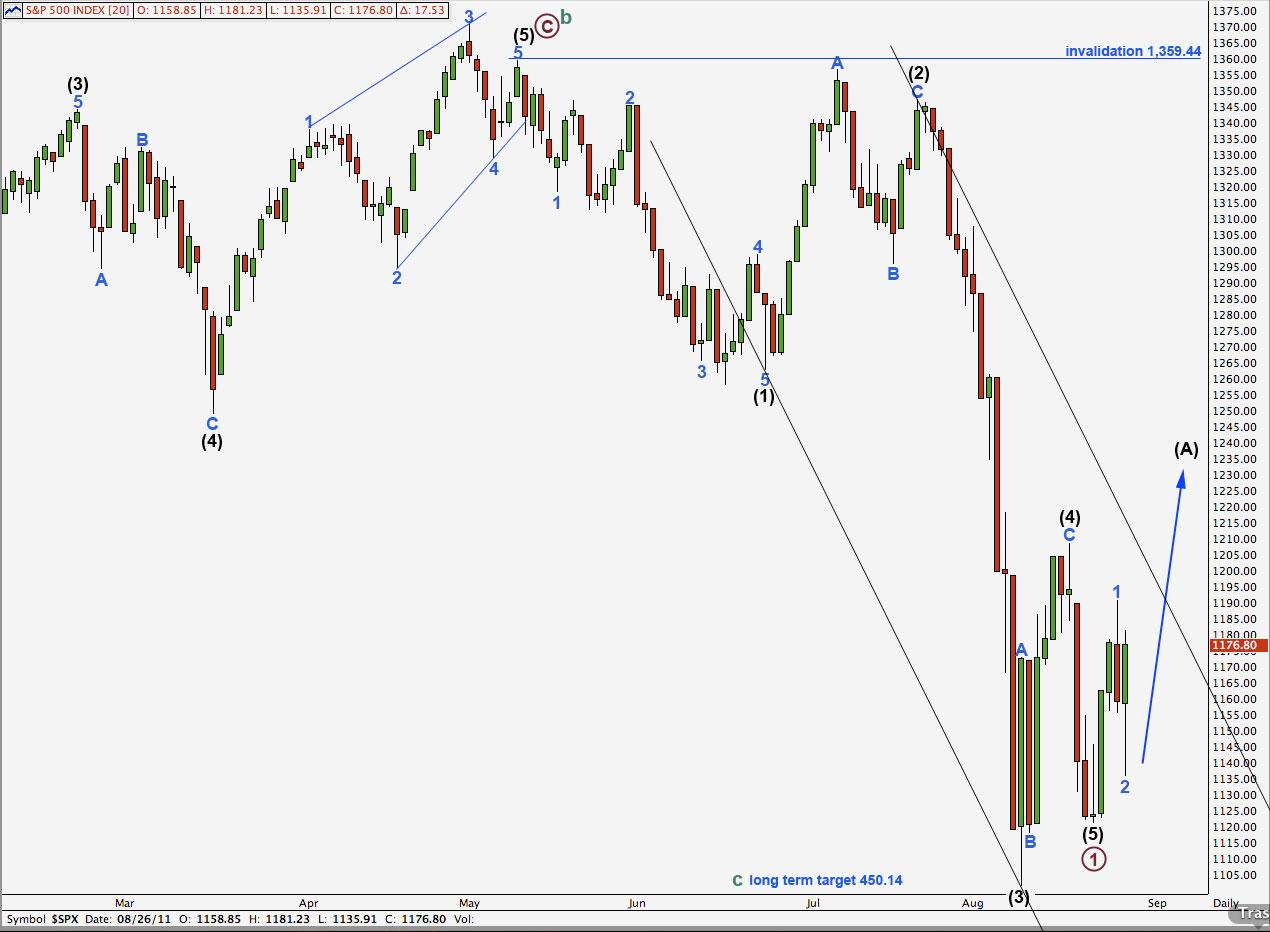
It is possible that primary wave 1 is over and recent upwards movement is black wave (A) within primary wave 2.
If price moves above 1,208.47 in the next couple of days in strong upwards movement this will be our only wave count. At that stage both wave counts for the main daily chart will be invalidated.
This wave count sees waves (4) and (5) black both over, and wave (5) black truncated. This could have happened after that particularly strong third wave down moved price “too far too fast”.
It sees remarkably brief fourth and fifth waves and, along with the truncation, this is why I have not previously published this wave count.
I think we should only use it if it is shown to be correct with price movement above 1,208.47.
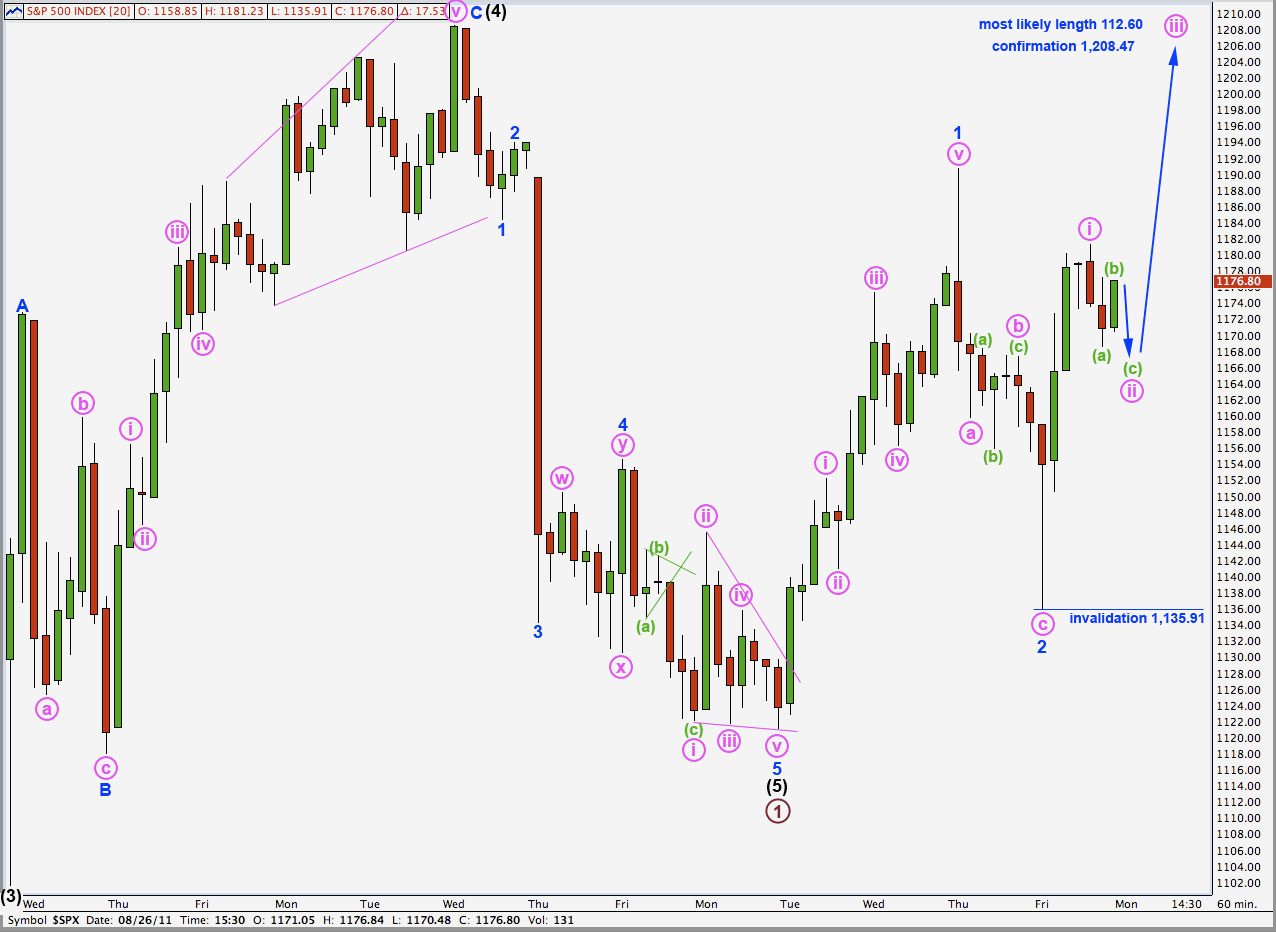
The important implication of this wave count is that it is expecting a third wave of a third wave upwards to begin probably on Monday.
Because we don’t know exactly where wave ii pink has ended we cannot calculate a target for wave iii pink. We may expect wave iii pink to most likely be 1.618 the length of wave i pink which would see it 112.60 points in length.
Wave ii pink may not move beyond the start of wave i pink. This wave count is invalidated with movement below 1,135.91.
Lara,
In my prior comment, I meant to say intermediate wave 1 down. The time frame would seem to fit for this.
Peter
Lara,
Have you considered that what you have labeled the end of Primary 1 might only be the end of Minor 1 Black. In that case we could get a relatively brief three wave up for Black 2 and then the resumption of the downtrend.
I am just thinking that this cycle wave C down might be a much longer affair (perhaps a few years).
Peter
Yes I have, and the best time to look at the degree of labeling within this new downwards trend would be to wait until this primary 2 is well underway.
I’m also looking at the whole degree of labeling on the monthly, weekly and daily chart. I am thinking we should be moving it all down one degree anyway.
Sometimes the most difficult aspect of EW analysis is the degree of labeling. It does not matter so much at the beginning of a movement, but towards the middle and at the end it is crucial.
Why can wave 4 not still be unfolding as a
contracting triangle?
It can, and this scenario is covered in the second hourly wave count of the first published analysis (not this update).
For both a flat or a triangle wave B blue must complete it’s zigzag. For both an expanded flat or a running triangle B may move beyond the start of A (to make a new low). So this hourly wave count is exactly the same at this stage for both structural possibilities.
If I did another hourly wave count for a triangle at this stage it would look exactly the same as the second hourly wave count in the main analysis for the end of week.