
Elliott Wave chart analysis for the Gold for 23rd August, 2011. Please click on the charts below to enlarge.
Olive labels are super cycle and teal green labels are cycle. For a wave notation table go here.
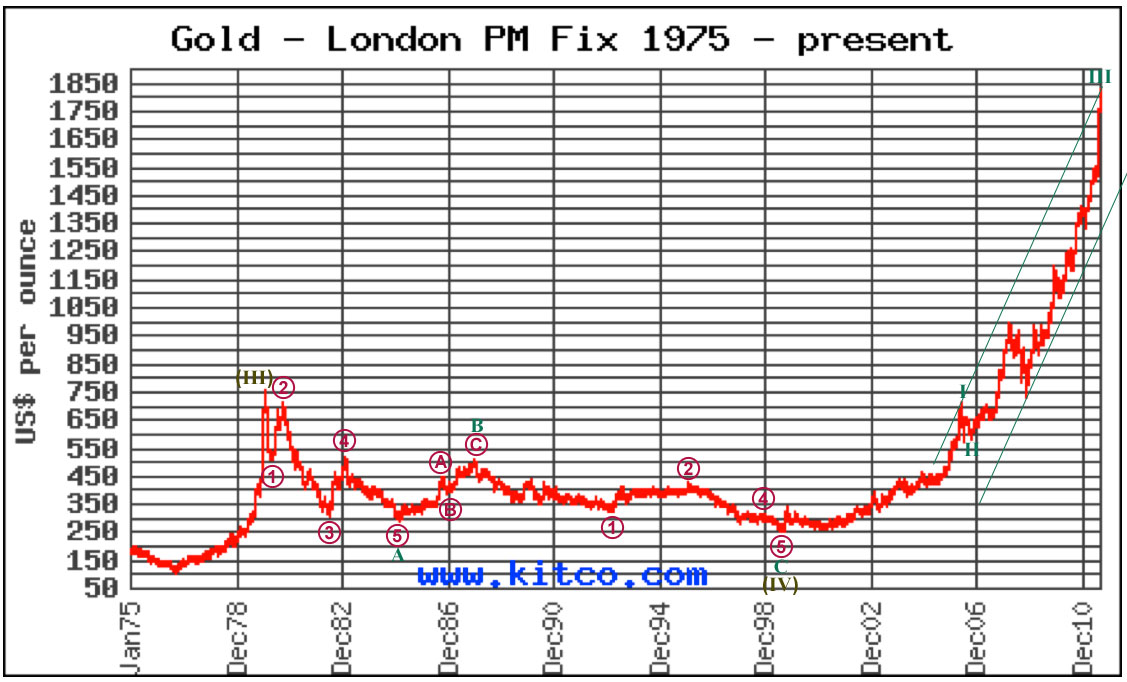
There are some remarkably good fibonacci relationships in this analysis.
Cycle wave A ending Feb 1985 lasted a fibonacci 54 months. Cycle wave B ending Dec 1987 was a 50% correction of wave A and lasted a fibonacci 34 months. Cycle wave C is 234.61 in length and is just 3.16 longer than 0.618 the length of cycle A, and lasted 141 months, just 3 short of a fibonacci 144.
Please note: the chart above is on a logarithmic scale.
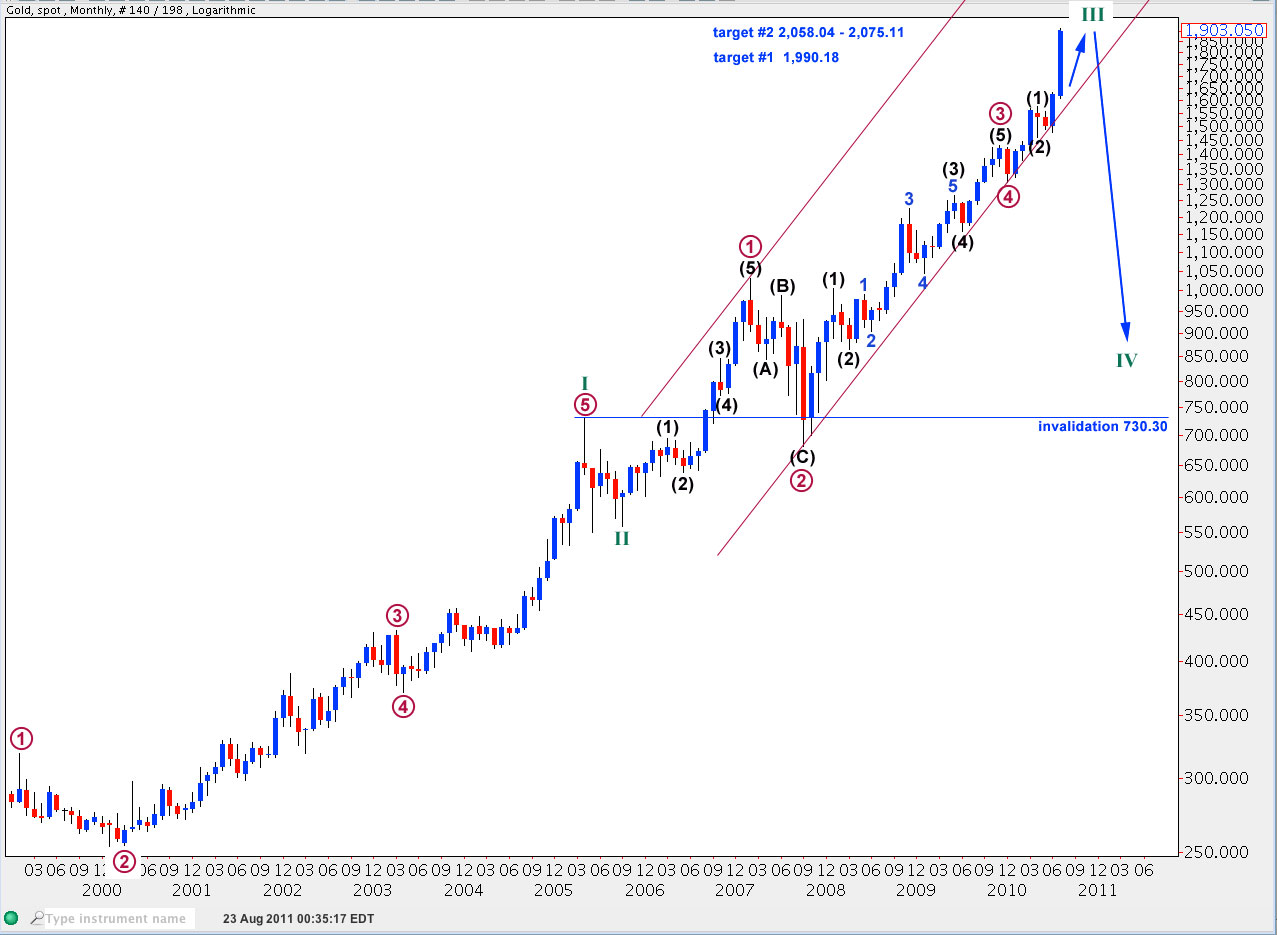
Last analysis of 11th May monthly chart had two targets. The first target at 1,581.99 to 1,629.43 was exceeded. The second target at 1,919.96 is now close by and I wanted to see if the wave structure was nearing completion.
I think that primary wave 3 within cycle wave III ended at 1,430.94. At this point primary wave 3 is just 16.28 short of 1.618 the length of primary wave 1.
Primary wave 5 of cycle wave III would have begun at 1,308.2. At 2,058.04 primary wave 5 will reach equality in length with primary wave 3. This gives us the lower end of the second target zone.
We may use Elliott’s channeling technique to draw a channel about cycle wave III. First draw a trend line from the lows of primary waves 2 and 4, then place a parallel copy on the high of primary wave 1. Primary wave 5 to end cycle wave III may end about the upper edge of this parallel channel.
Ratios within primary wave 1 are: black wave (3) has no Fibonacci ratio to black wave (1) and black wave (5) is 5.27 longer than 1.618 the length of black wave (1).
Ratios within primary wave 3 are: black wave (3) has no Fibonacci ratio to black wave (1) and black wave (5) is 26.33 longer than 0.618 the length of black wave (3).
Ratios within black wave (3) of primary wave 3 are: blue wave 3 is 7.18 longer than 2.618 the length of blue wave 1 and blue wave 5 is 17.87 longer than blue wave 1.
This wave count sees gold as within the final fifth wave upwards to complete a cycle degree third wave. When cycle wave III is complete then gold should turn downwards for a fourth wave at cycle degree which should last at least a year and may not take price below the end of cycle wave I at 730.30.
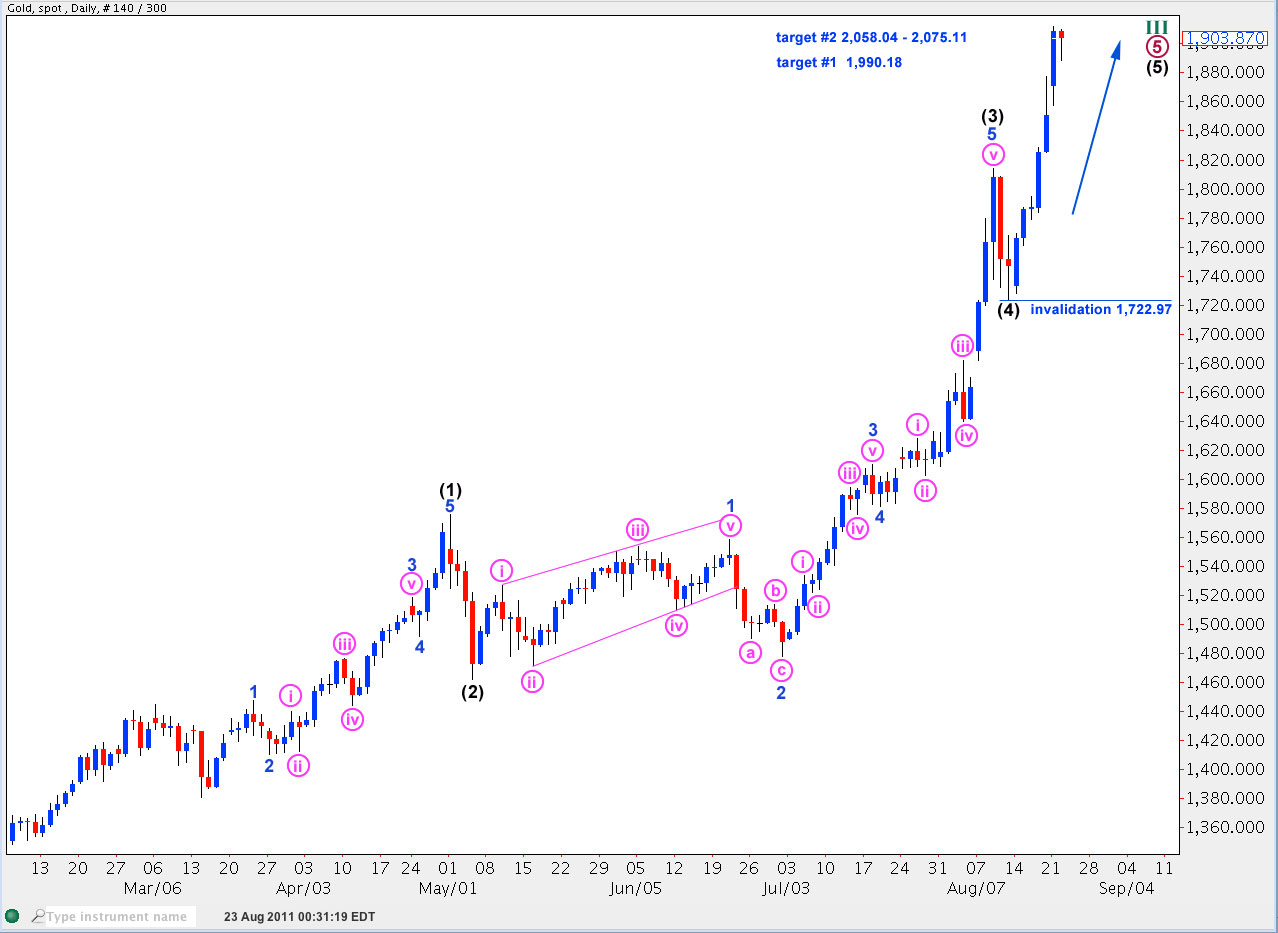
The daily chart above shows the wave structure within primary wave 5 which begins at 1,308.20, just off to the left of the chart.
The only concern I have with this wave count is the leading diagonal of wave 1 blue within (3) black. Here the third wave is the longest, the diagonal is contracting because wave iv is shorter than wave ii, and wave v is shorter than wave i. Wave iv overlaps wave i price territory as it should for a diagonal, but the third wave should be shorter than the first. However, I often see diagonals which meet all the rules except for the length of the third wave. Third waves have a tendency to be the longest.
Ratios within wave (1) black are: wave 3 blue has no Fibonacci ratio to wave 1 blue and wave 5 blue is just 2.65 short of 0.618 the length of wave 1 blue.
Ratios within wave 3 blue of wave (1) black are: wave iii pink has no Fibonacci ratio to wave i pink and wave v pink is just 2.88 short of 2.618 the length of wave i pink.
Ratios within wave (3) black are: wave 3 blue has no Fibonacci ratio to wave 1 blue and wave 5 blue is 20.06 longer than 1.618 the length of wave 3 blue.
Within wave 3 blue of wave (3) black there are no adequate Fibonacci ratios between waves i, iii and v pink.
Ratios within wave 5 blue of wave (3) black are: wave iii pink is just 2.52 short of 1.618 the length of wave i pink and wave v pink has no Fibonacci ratio to either of i or iii pink.
Black wave (5) would reach equality with black wave (3) at 2,075.11. This gives us the upper end of the second target zone.
Black wave (5) will pass equality with black wave (1) at 1,990.18. There is a possibility that it may end about this point. If it does not then the second target zone above would be the next most likely place for it to end.
If this wave count is correct then movement below 1,722.97 after completion of wave (5) black will be confirmation that gold has found a high for the next year or so. Cycle wave IV should last at least a year, if not several.
Lara-be great if we can have regular gold updates!
thanks again
I know, it would.
At this stage I just don’t have the time. I’m trying to move my focus away from my forex site and more towards this stock market site. I have realised that I cannot keep up with both forever and now I have two analysts for forex to take the load off.
The next task is for me to increase the membership of this stock market site which is abysmally low. That’s probably because it has had almost no marketing done for it. This takes time.
When I have enough members on this site I can relax a little and give you all more one off analysis of other markets. So that is why it is not going to happen in the immediate future. But I’m working on it 🙂