Elliott Wave chart analysis for the S&P 500 for 3rd August, 2011. Please click on the charts below to enlarge.
The S&P behaved again as expected moving lower, then beginning a small correction 1.23 points below our short term target for yesterday’s market.
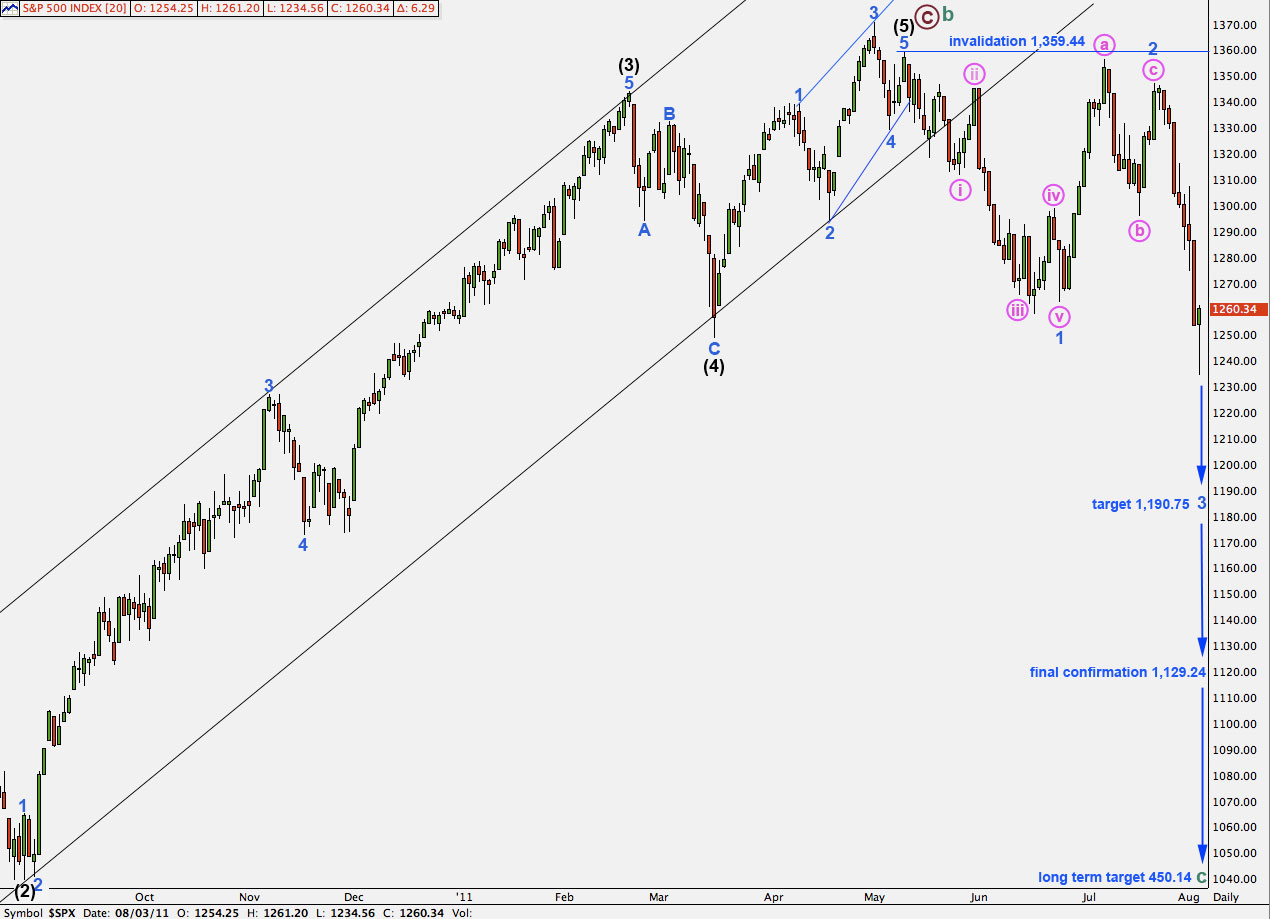
Downwards movement is exhibiting typical third wave behaviour.
We should expect a continuation of downwards movement for at least a year to an eventual long term target at 450.14 where cycle wave c would reach equality with cycle wave a.
Our mid term target is at least two weeks away still. Wave 3 blue would reach 1.618 the length of wave 1 blue at 1,190.75.
The invalidation point at 1,347 expects no second wave correction within wave 3 blue to move beyond the start of its first wave.
When price eventually moves below 1,129.24 that will be full and final confirmation that the S&P is in a bear market to make new lows and which should last at least a year if not longer (from the start in February 2011).
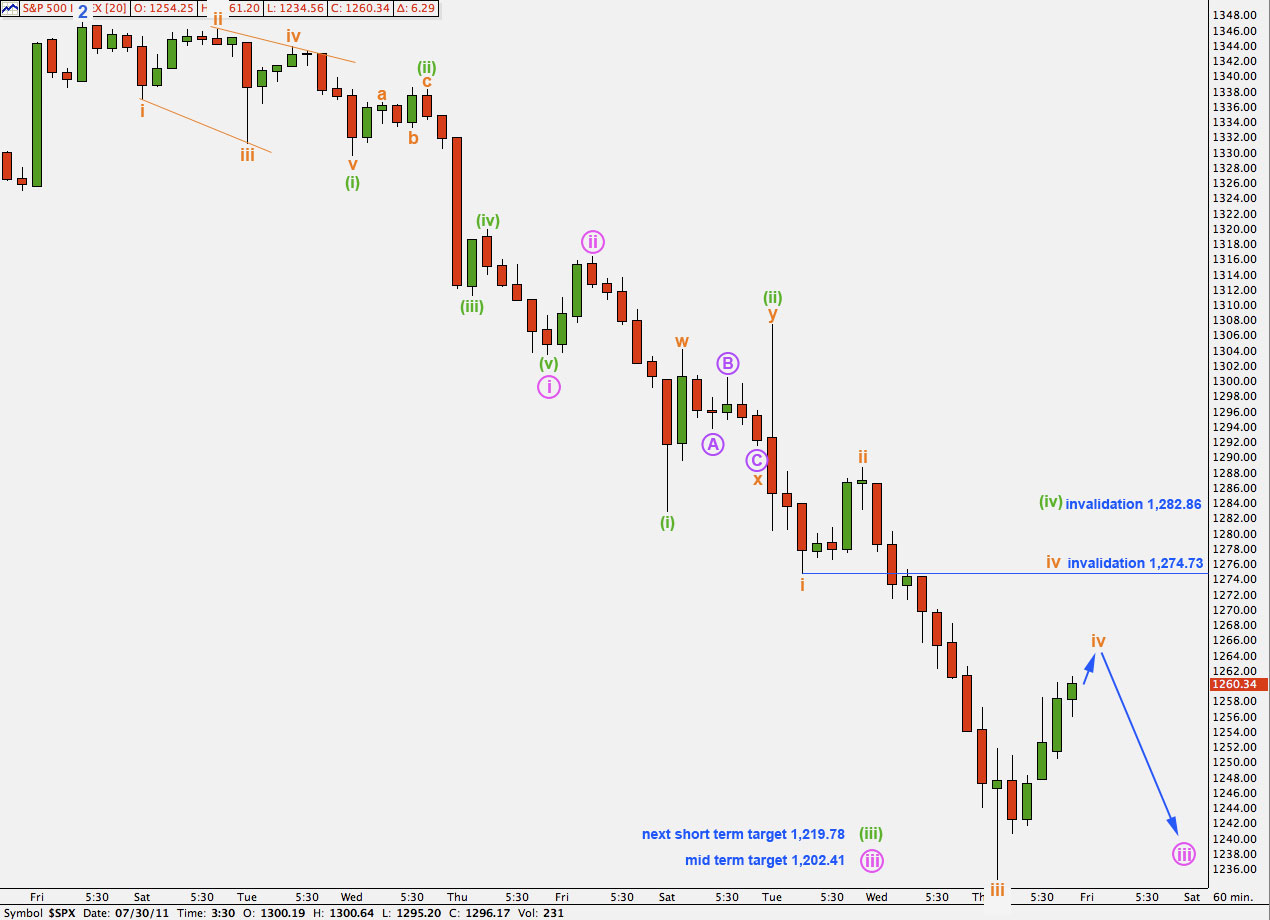
Our first short term target which we expected to be reached yesterday for wave iii orange was at 1,235.79. Price reached to 1,234.56 and so wave iii orange is just 1.23 points longer than 1.618 the length of wave i orange.
Wave iv orange is an incomplete structure on the 5 and 15 minute chart. We should expect a little more upwards movement to begin tomorrow’s session. Wave iv orange may not move into wave i orange price territory. This wave count is invalidated with movement above 1,274.73.
If this wave count is invalidated by upwards movement then we would relabel the end of this movement 1 and 2 purple within wave iii orange. The invalidation point would then be at the start of wave iii orange at 1,288.62.
When this fourth wave correction is complete we should expect another downwards movement to new lows. The next target is at 1,219.78 and may be reached within another one to two sessions.
This wave count has a very typical look. The structure requires further downwards movement and so this is what we should expect for the next few days or so.


Lara,
Just trying to figure out a low risk entry to play the short side as this move continues to unfold. I am looking to enter and possibly hold for most of the projected downturn, but I am thinking that it might make sense to wait for Black 1 to complete, and then to enter after the Black 2 retrace, which hopefully will be reasonably deep and provide a good low-risk entry point.
Any thoughts?
Peter
I think with a third wave like this you may have to hold your breath and jump in! 🙂
The trick is getting out at the right time.
The general idea with trading with Elliott wave analysis is to pick the end of a correction to enter at.
Black wave 1 has a way down to go yet. If we move the degree of labeling up one degree we could have just passed the middle of black wave 3. That is a possibility, but we would then expect to see black wave 5 be about equal in length with black 3, and black 4 should be shallow.
I recently wrote an article outlining one approach for trading using Elliott wave analysis. You will find it on my Forex website: How To Trade Using Elliott Wave Analysis