
Elliott Wave chart analysis for the S&P 500 for 25th July, 2011. Please click on the charts below to enlarge.
Main Wave Count.
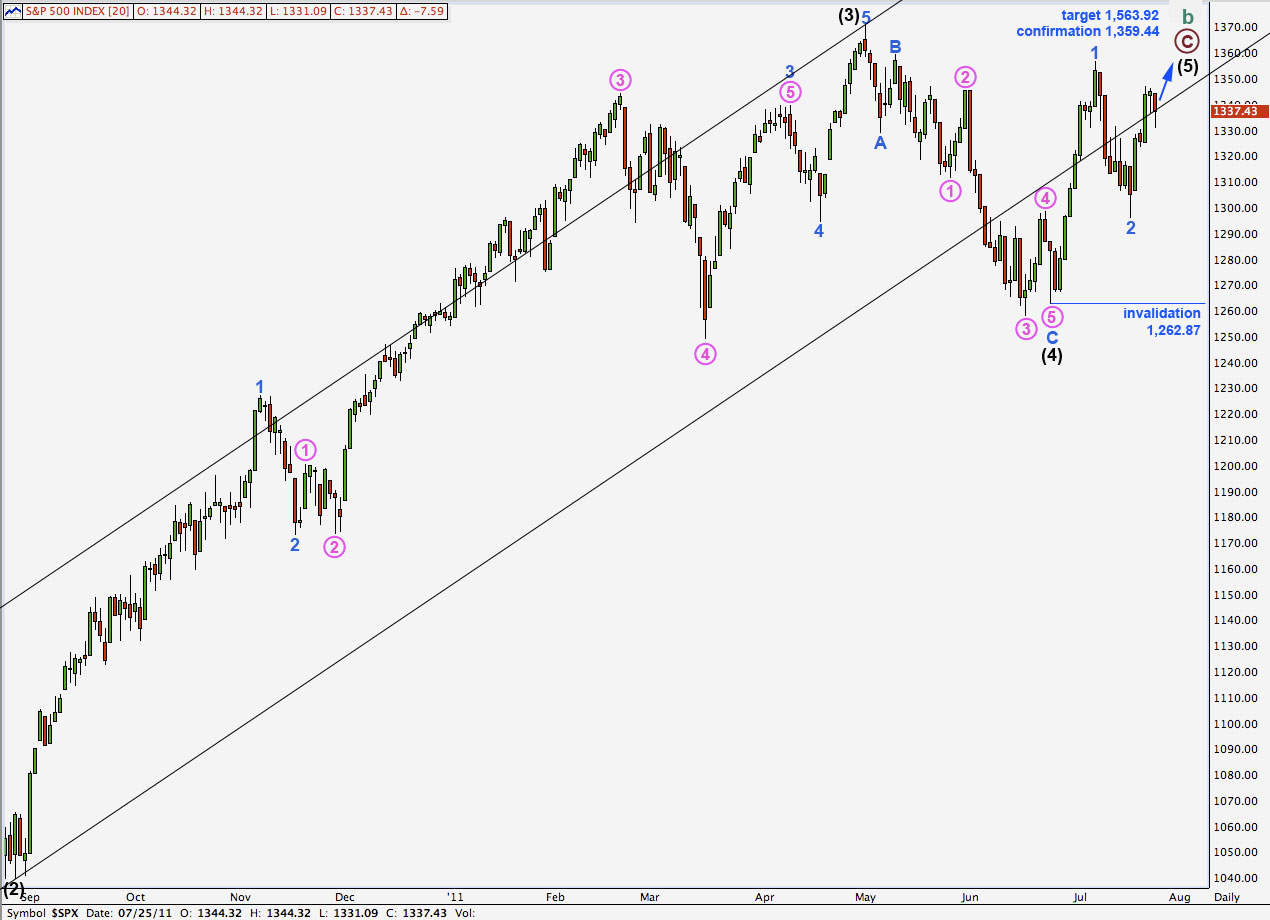
Downwards movement during Monday’s session invalidated both hourly wave count, which was not what we were expecting.
This wave count remains our more likely wave count at this stage.
It would be confirmed if price moves above 1,359.44. While price remains below this point both our wave counts will be valid.
If price moves above 1,359.44 we should expect it to continue to at least 1,494.15 where cycle wave b will reach 90% the length of cycle wave a. It is highly likely to reach 1,563.92 where primary wave C would reach equality with primary wave A.
Within intermediate (black) wave (5) there will be two reasonably sized corrections. We have already seen one with blue wave 2. Wave 4 blue may most likely be a shallow flat or triangle.
Any further extension of blue wave 2 downwards may not move beyond the start of wave 1 blue. This wave count is invalidated with movement below 1,262.87.
Positives for this wave count:
– we can see cycle wave A as a three wave structure and expect upwards movement for cycle wave B to reach at least to 1,494.15 where it will be 90% the length of cycle wave A.
– the problem of how to see the last piece of upwards movement to end black wave 3 is completely resolved.
– recent wave behaviour fits expectations for this wave count.
– with a new all time high possible for this wave count it fits with other indices which have made new all time highs.
Negatives for this wave count:
– wave 4 pink within wave 3 blue within wave 3 black is out of proportion to other corrections of a higher wave degree; it is too large.
– it does not have as good a fit within its trend channel as the main wave count does.
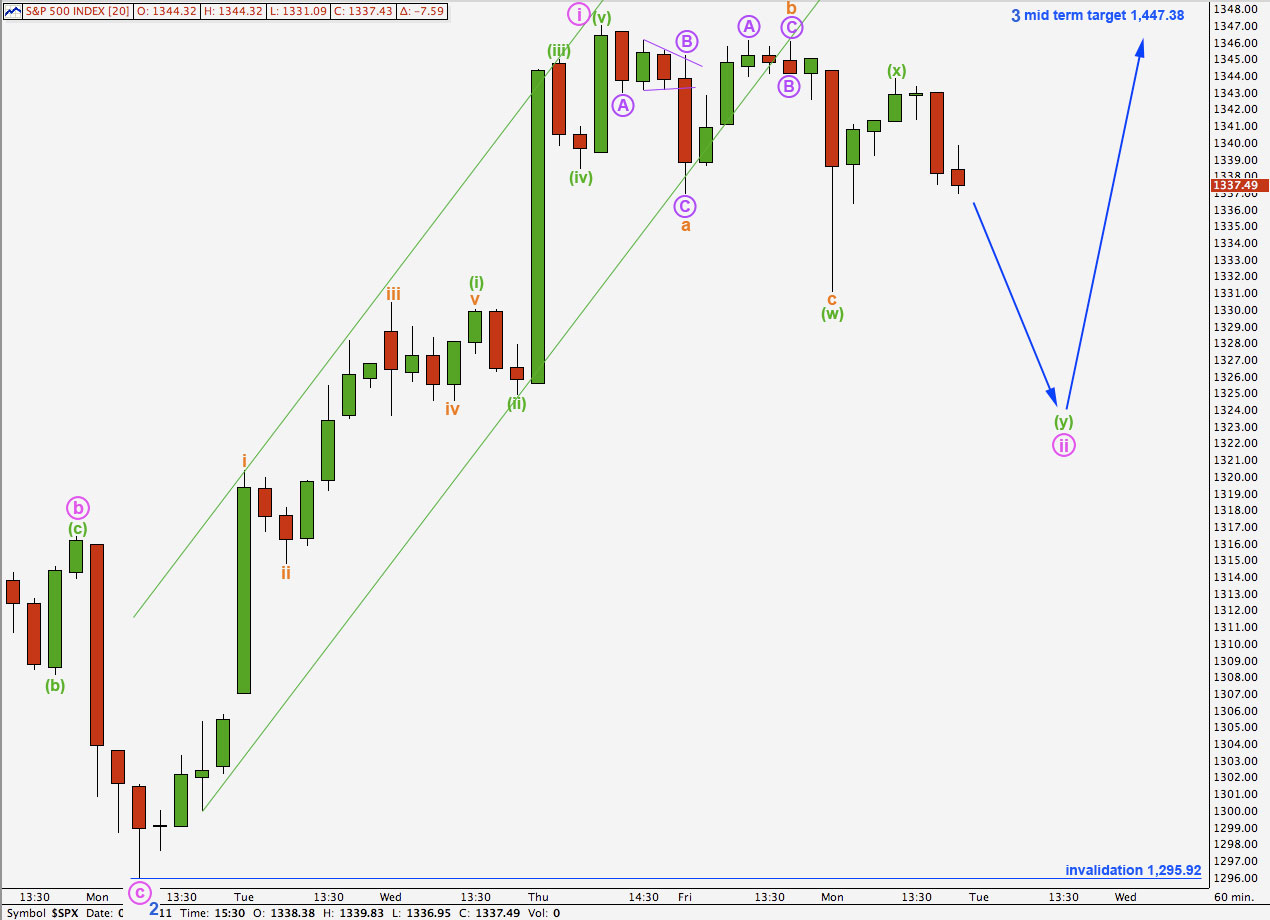
A best fit trend channel drawn about upwards movement for wave i pink is clearly broken by now. Movement below 1,336.95 invalidated last hourly wave count. This has necessitated a reanalysis of recent movement.
Wave i pink can be seen as a complete structure. Ratios within wave i pink are: wave (iii) green is 1.03 points short of 0.618 the length of wave (i) green, and wave ((v) green is 0.9 points longer than 0.382 the length of wave (iii) green.
Ratios within wave (i) green are: wave wave iii orange is just 0.55 points longer than 0.618 the length of wave i orange, and wave v orange is just 0.56 points short of 0.382 the length of wave iii orange.
Wave (i) green is a fractal of wave i pink. With excellent Fibonacci ratios within this upwards movement this wave count has a high probability.
Wave ii pink looks like it is unfolding as a double flat or double combination correction because the upwards movement labeled (x) green looks most like a three wave structure on the 1 minute and 5 minute chart. This indicates that further downwards movement is to come to finish wave ii pink.
Wave ii pink may not move beyond the start of wave i pink. This wave count is invalidated with movement below 1,295.92.
Alternate Wave Count.
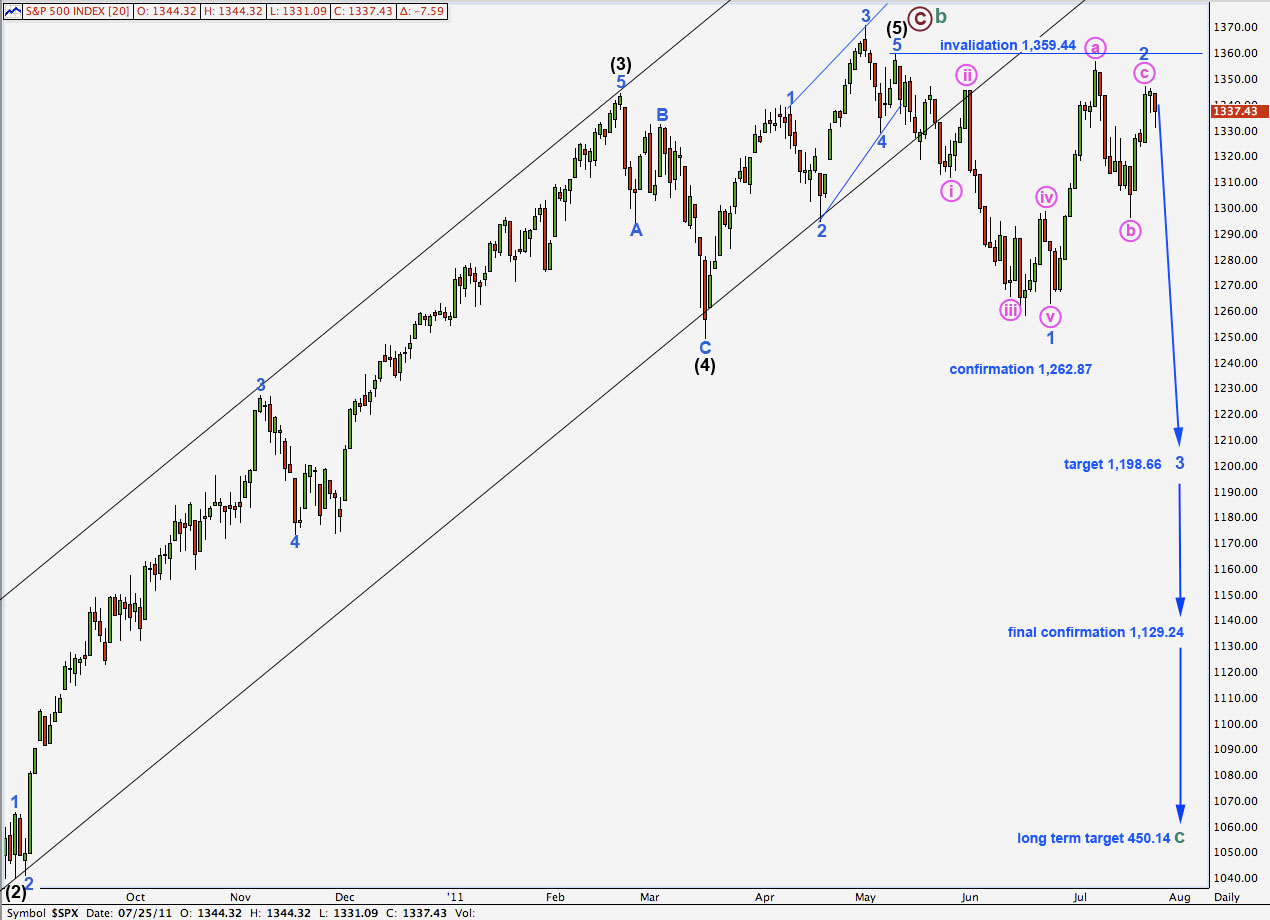
Wave 2 blue may be complete with a truncated C wave. There is no Fibonacci ratio between waves a and c pink within wave 2 blue.
The truncation further reduces the probability of this wave count.
Positives for this wave count:
– it has a good fit in its trend channel.
– within primary wave C the proportions of black and blue waves look good.
– it explains the strong trend channel breach with recent downwards movement.
Negatives for this wave count:
– within the ending diagonal of wave 5 black it must see waves 1 and 3 blue as zigzags and this is stretching credulity a bit.
– I would have expected cycle B to reach 90% of cycle A at 1,494.15 because cycle A is most easily seen as a three wave structure, so then this would be a super cycle flat correction. With cycle wave B less than 90% of cycle wave A we have to see cycle wave A as a five wave structure which does not have a good fit.
– recent wave behaviour does not fit with expectations for this wave count.
– within wave 2 blue zigzag correction wave c pink is strongly truncated.
Wave 2 blue may not move beyond the start of wave 1 blue. This wave count is invalidated with movement above 1,359.44.
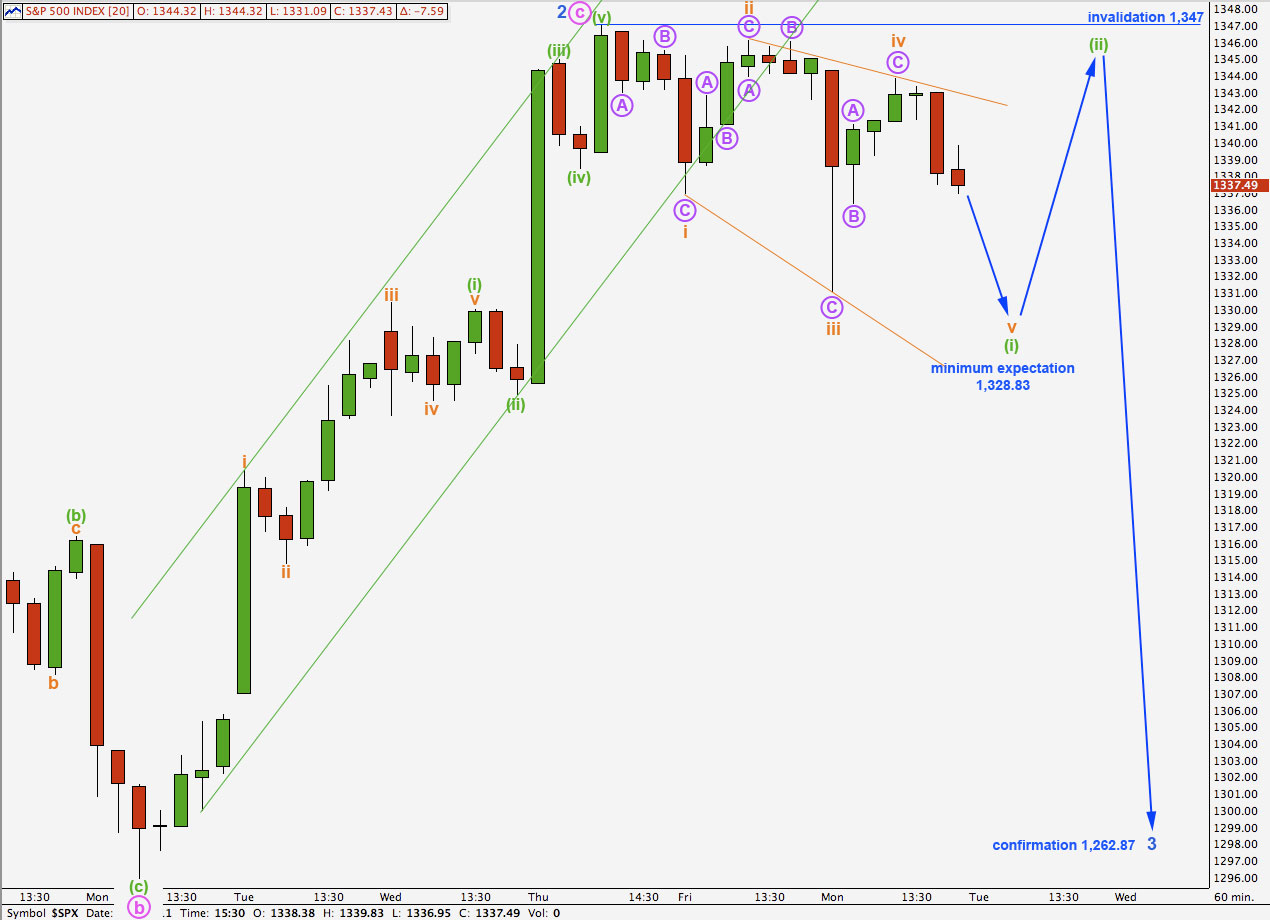
The overlapping zigzag movement of the last three sessions may be a leading diagonal for a first wave.
A leading diagonal may not have a truncated fifth wave. We would expect movement to a new low below the end of wave iii orange which is at 1,331.09.
The diagonal is expanding. We would therefore expect wave v orange to be longer than wave iii orange. Wave v orange would reach equality with wave iii orange at 1,328.83 and so this is a minimum expectation for downwards movement.
Wave (ii) green upwards should follow the end of wave (i) green and should be a deep correction.
Wave (ii) green may not move beyond the start of wave (i) green. This wave count is invalidated with movement above 1,347.
Thanks Lara!
Always great work.
John A