
Elliott Wave chart analysis for the S&P 500 for 20th July, 2011. Please click on the charts below to enlarge.
Main Wave Count.
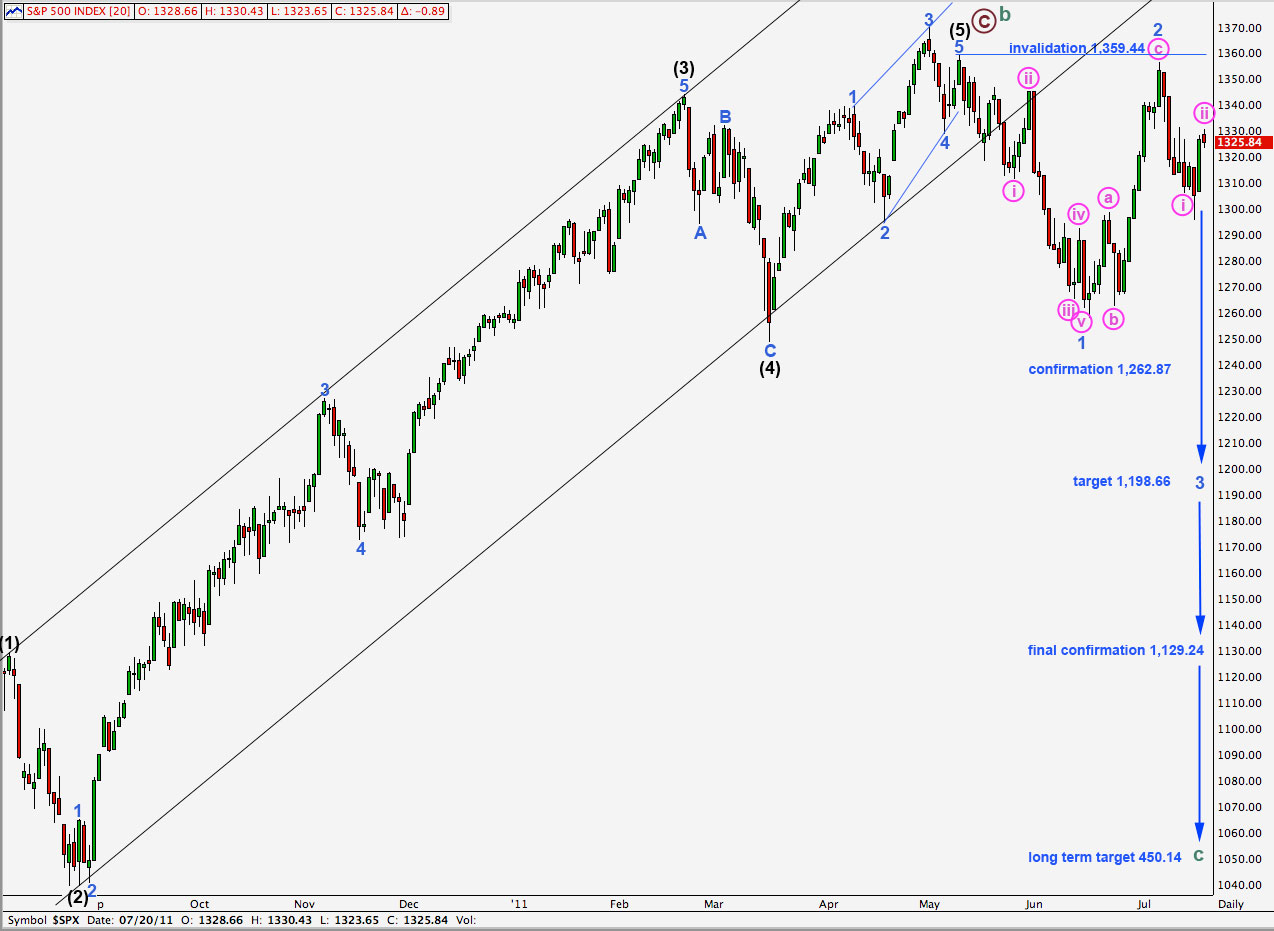
Although price has moved a little higher, and mostly sideways for Wednesday’s session, wave ii pink has remained below 0.5 of wave i pink. If price moves above 1,331.64 then wave ii pink will be over the 0.5 ratio of wave i pink.
Positives for this wave count:
– it has a good fit in its trend channel.
– within primary wave C the proportions of black and blue waves look good.
– it explains the strong trend channel breach with recent downwards movement.
Negatives for this wave count:
– within the ending diagonal of wave 5 black it must see waves 1 and 3 blue as zigzags and this is stretching credulity a bit.
– I would have expected cycle B to reach 90% of cycle A at 1,494.15 because cycle A is most easily seen as a three wave structure, so this would be a super cycle flat correction.
Wave 2 blue may not move beyond the start of wave 1 blue. This wave count is invalidated with movement above 1,359.44.
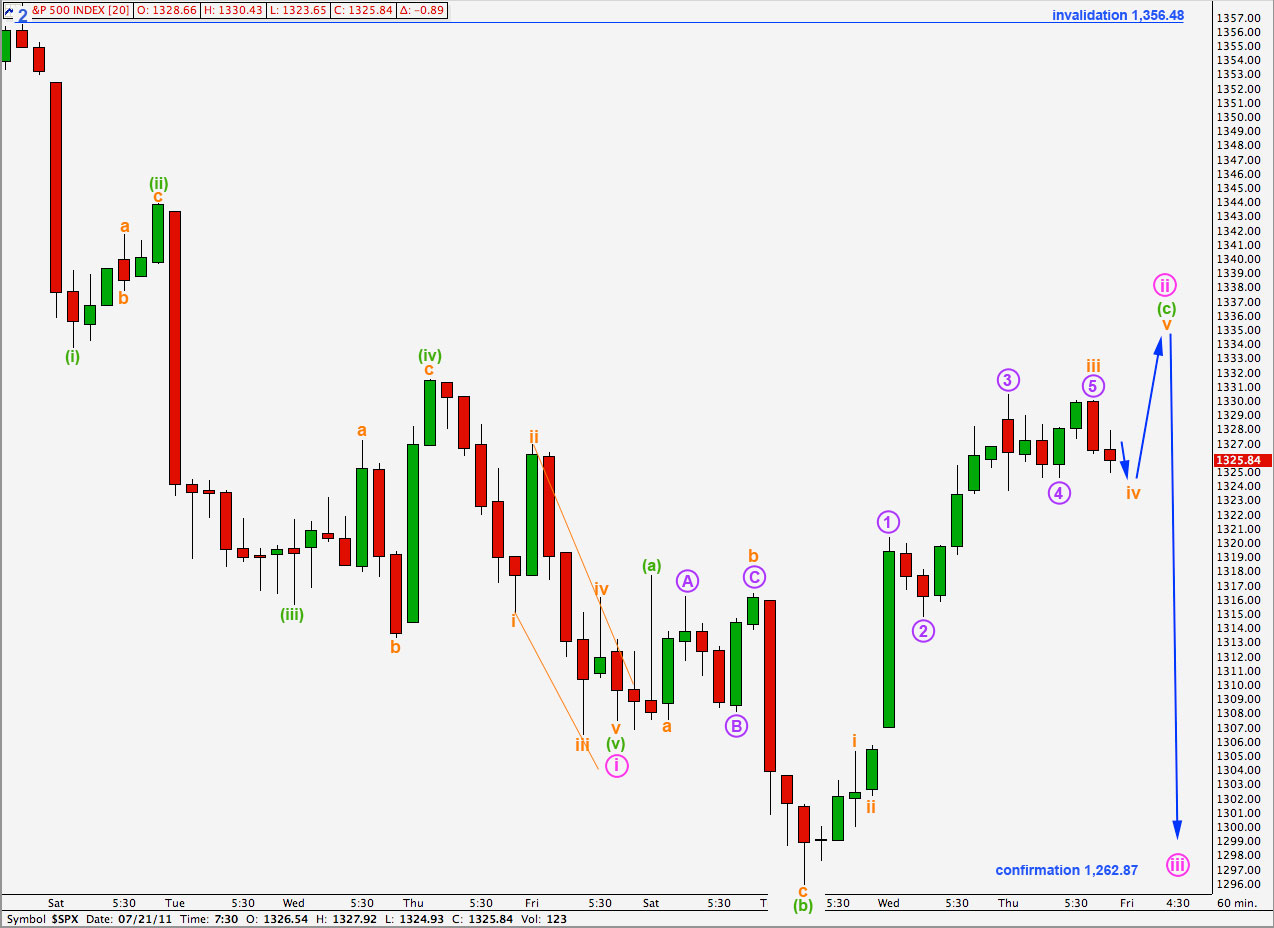
Wave ii pink has extended a little higher.
Wave (c) green of the expanded flat correction for wave ii pink is developing an extension within one of its actionary waves. The extension is most likely within the third wave.
Wave iii orange has no Fibonacci ratio to wave i orange. Wave v orange may only reach equality with wave i orange which was 9.39 points in length.
Ratios within wave iii orange of wave (c) green are: wave 3 purple is 1.25 points longer than 0.618 the length of wave 1 purple and wave 5 purple is just 0.17 points short of 0.382 the length of wave 3 purple.
Wave iv orange is an incomplete corrective structure and so markets are most likely to open tomorrow with a little downwards movement.
Wave ii pink will pass the 0.5 ratio of wave i pink at 1,331.64. If price continues above this point the probability of this wave count decreases.
Wave ii pink may not move beyond the start of wave 1 pink. This wave count is only invalidated with movement above 1,356.48.
Alternate Wave Count.
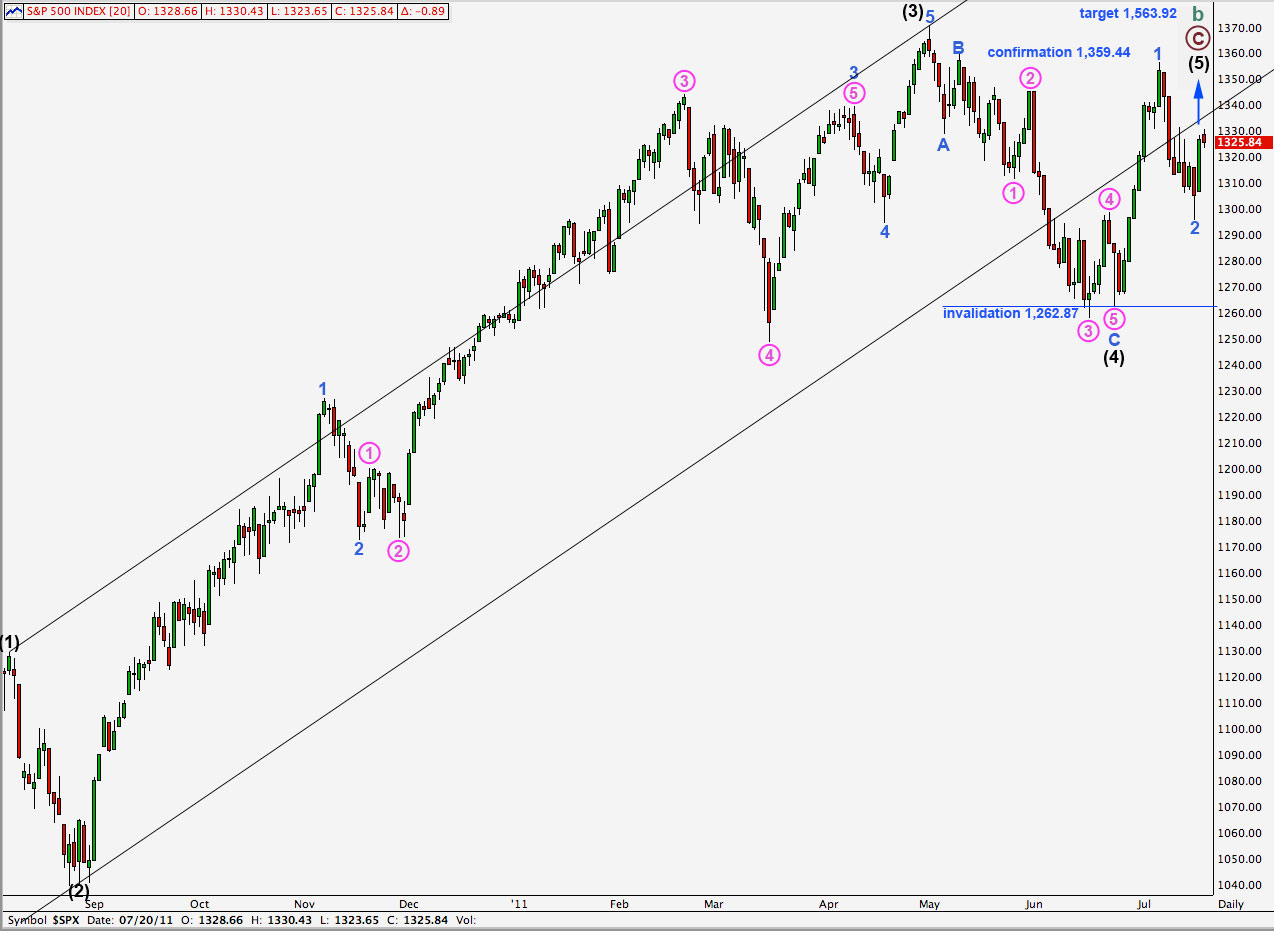
This wave count remains less likely than the main wave count because the problems with it at minute (pink) degree to intermediate (black) degree here on the daily chart are greater.
Positives for this wave count:
– we can see cycle wave A as a three wave structure and expect upwards movement for cycle wave B to reach at least to 1,494.15 where it will be 90% the length of cycle wave A.
– the problem of how to see the last piece of upwards movement to end black wave 3 is completely resolved.
– recent wave behaviour fits expectations for this wave count.
– with a new all time high possible for this wave count it fits with other indices which have made new all time highs.
Negatives for this wave count:
– wave 4 pink within wave 3 blue within wave 3 black is out of proportion to other corrections of a higher wave degree; it is too large.
– it does not have as good a fit within its trend channel as the main wave count does.
Wave 2 blue may not move beyond the start of wave 1 blue. This wave count is invalidated with movement below 1,262.87.
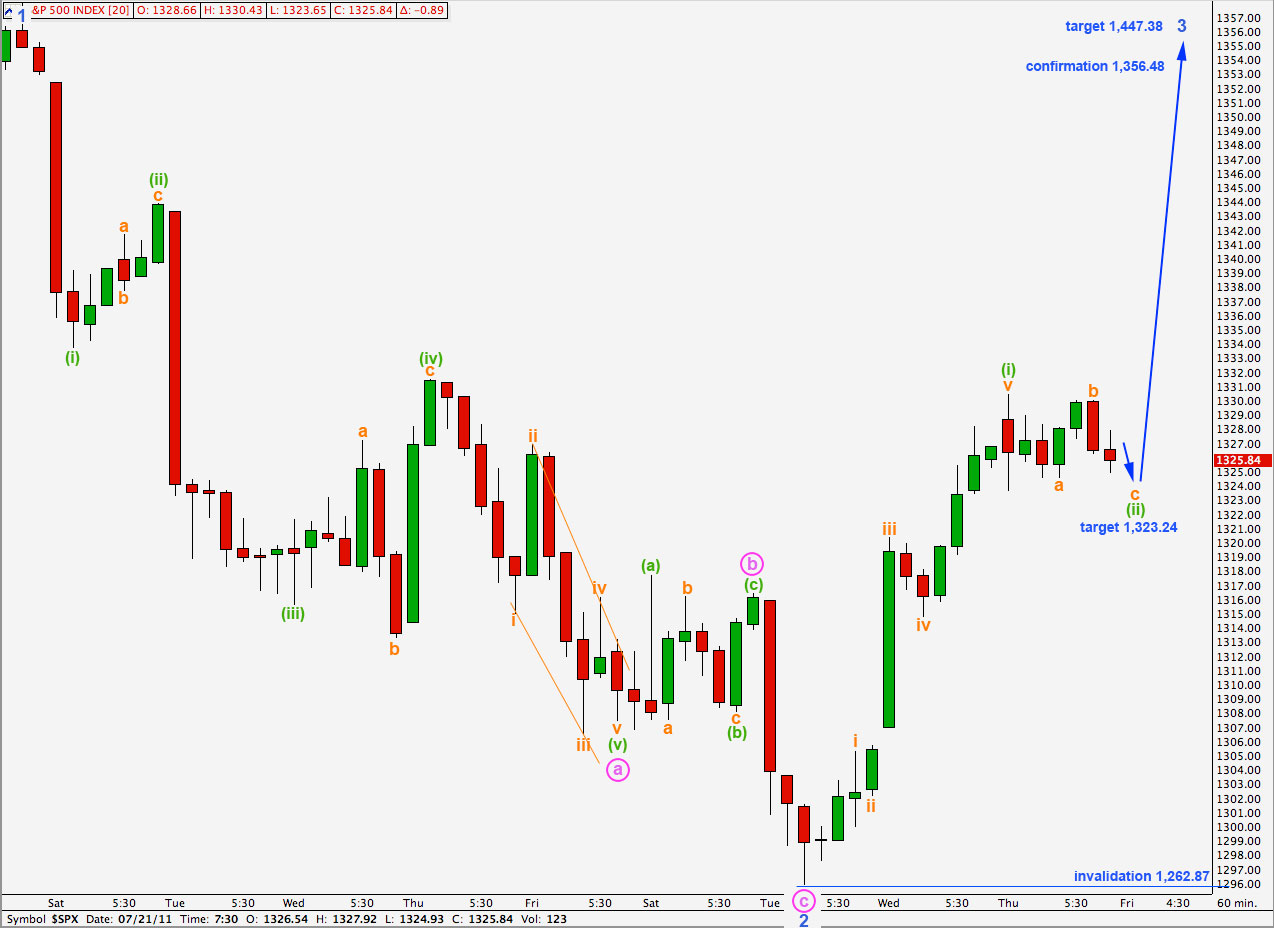
Wave behaviour for Wednesday’s session fits with this wave count well.
Wave (ii) green is incomplete, wave c orange requires further downwards movement. At 1,323.24 wave c orange would reach equality with wave a orange for this flat correction.
Thereafter, we should expect a continuation of upwards movement for this wave count.
Movement above 1,356.48 would invalidate the main wave count and so confirm this alternate.
Wave (ii) green may not move beyond the start of wave (i) green. This wave count is invalidated with movement below 1,262.87.
Thank you so much for the work you do! I have been out of the loop for some time, but, I always manage to keep my eye on the charts. I just touched back to see what you are observing. Quite fascinating. I’m darned curious to see what unfolds.
Wishing You All the BEST!
John A
As we have seen this week and last the crash is now upon us.
In the end it turned out to be hard to hold to a bear wave count when I should have.
In future I will remember that the more negative feedback and comments I get, and the more people tell me my wave count has all sorts or problems and broken rules in it (it does not) then the more likely it is to be right.
I caught a lot of criticism for that wave count, and now it has been spectacularly proven right the detractors are silent. Which is how I like it 🙂